1. MONEY MARKET FUNDS
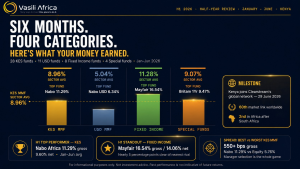
In the month of July 2023, Enwealth Money Market Fund was the best-performing MMF with an average Effective Daily Yield of 11.43%.
In second place were Etica Money Market Fund and Cytonn Money Market Fund, both recording an average Effective Daily Yield of 11.41%. The third best-performing MMF was the Apollo Money Market Fund with an average Effective Daily Yield of 10.95%.
To note, to get the true rate of a money market fund, remove the withholding tax of 15% from the announced yield. Some funds though report net return after the withholding tax.
| FUND MANAGER | MONEY MARKET FUND | Avg. Daily Yield % | |
| 1 | Enwealth Financial Services | Enwealth Money Market Fund | 11.43 |
| 2 | Etica Capital Limited | Etica Money Market Fund | 11.41 |
| 3 | Cytonn Asset Managers Limited | Cytonn Money Market Fund | 11.41 |
| 4 | Apollo Asset Management Company Limited | Apollo Money Market Fund | 10.95 |
| 5 | GenAfrica Asset Managers Limited | GenAfrica Money Market Fund | 10.77 |
| 6 | Jubilee Financial Services Limited | Jubilee Money Market Fund | 10.75 |
| 7 | Madison Investment Managers Limited | Madison Money Market Fund | 10.64 |
| 8 | Zimele Asset Management | Zimele Money Market Fund | 10.56 |
| 9 | Old Mutual Investment Group | Old Mutual Money Market Fund | 10.50 |
| 10 | Co-op Trust Investment Services Limited | Co-op Money Market Fund | 10.45 |
| 11 | Kuza Asset Management Limited | Kuza Money Market Fund (KES) | 10.45 |
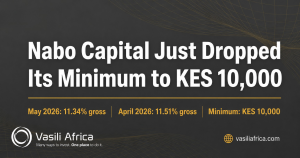
| 12 | Nabo Capital Limited | Nabo Africa Money Market Fund | 10.23 |
| 13 | African Alliance | African Alliance Kenya Money Market Fund | 10.19 |
| 14 | Genghis Capital | GenCap Hela Imara Fund | 10.10 |
| 15 | Sanlam Investments East Africa Limited | Sanlam Money Market Fund | 10.06 |
| 16 | KCB Group | KCB Money Market Fund | 9.86 |
| 17 | ICEA Asset Lion Asset Management Limited | ICEA Lion Money Market Fund | 9.84 |
| 18 | CIC Asset Managers Limited | CIC Money Market Fund | 9.48 |
| 19 | ABSA Bank | Absa Shilling Fund MMF | 9.41 |
| 20 | Britam Asset Managers (Kenya) Limited | British-American Money Market Fund | 9.21 |
| 21 | Orient Asset Managers | Orient Kasha Money Market Fund | 9.04 |
2. FIXED-INCOME SECURITIES
• TREASURY BONDS
TAP SALE – FXD1/2023/5 & RE-OPENED FXD1/2016/10
In the primary market for the month of July, the Government was looking to raise KES 20.00Bn for budgetary support through the Tap sale of FXD1/2023/5 and FXD1/2016/10.
Particulars of the Bonds
| Name | Duration (years) | Coupon Rate |
| FXD1/2023/5 | 5 | 16.844% |
| FXD1/2016/10 | 3.2 | 15.039% |
● The minimum amount an investor could invest was KES. 50,000.
● Taxation
•Interest earned from the FXD1/2023/5 is subject to a withholding tax rate of 15%
•Interest earned from the FXD1/2016/10 is subject to a withholding tax rate of 10%
Results
In the primary market, the tap sale of the newly issued FXD1/2023/005 and the reopened FXD1/2016/10 were oversubscribed recording a 217.20% subscription with the CBK accepting KES 43.44Bn.
Summary
The oversubscription can mainly be attributed to investors continuing to prefer higher risk adjusted returns.
• TREASURY BILLS
WEEK 1 – 03/07/2023
T-bills were undersubscribed recording an overall decreased subscription rate of 39.54% from 63.91% recorded in the previous week.
WEEK 2 – 10/07/2023
T-bills were oversubscribed recording an increased overall subscription rate of 125.49% from 39.54% recorded in the previous week.
WEEK 3 – 17/07/2023
T-bills were oversubscribed for the second week recording an overall increased subscription rate of 151.85% from 125.49% recorded in the previous week.
WEEK 4 – 24/07/2023
T-bills were oversubscribed for the third week recording an overall increased subscription rate of 164.50% from 151.85% recorded in the previous week
WEEK 5 – 31/07/2023
T-bills were undersubscribed recording an overall decreased subscription rate of 38.10% from 164.50% recorded in the previous week.
Summary
Investors continued to show preference to the shorter-term 91-day paper, which can be attributed to investors continuing to see short-term risks in the market especially due to the heightened political risk in the country.
3. EQUITIES
During the month of July, the equities market recorded a mixed trend with NASI declining by 1.41% and NSE-20 gaining marginally by 0.15%.
Top Gainers for the month included Olympia Capital Holdings (+27.88%) driven by positive FY’23 results, Carbacid Investments (+22.02%) following commencement of hearing of its disputed case with BOC Kenya by the CMA tribunal, East African Cables (+20.25%), East African Portland Cement (+18.54%) and Eaagads (+16.67%).
Top Losers for the month included Sasini (-18.33%) mainly driven by a sharp decline in profit in HY’23, Longhorn Publishers (-14.29%) following the announcement of a profit warning, Home Afrika (-14.29%), Standard Group (-11.57%) and BOC Kenya (-11.38%).
Read more on our outlook on the Equities market in Kenya here: