1. MONEY MARKETS
In 2023, money markets recorded an exemplary performance, with the average market daily yields for the year coming in at 10.55% p.a., up from an estimated average daily yield of 8.60% in 2022.
To note, the top 5 money markets during the year recorded an average daily yield of 11.99%, just 30 bps below the 12.3% p.a. 91-day T-bill average yields for 2023. The significant surge in yields can be traced back to the soaring interest rates on government securities, as well as an increase in bank deposit rates and significant underlying asset classes for money market funds.
Additionally, 2023 saw seven new entrants join money markets, namely GenAfrica MMF, Jubilee MMF, KCB MMF, Etica MMF, Enwealth MMF, Lofty Corban MMF, and Mayfair MMF. To no surprise, the new market entrants were favored by the high entry interest rates to lead the performance for the year.
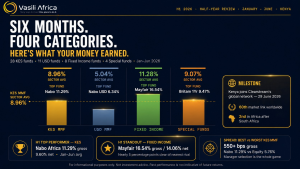
In terms of individual yields, Lofty-Corban MMF, which joined in July 2023, boasted the highest performance, recording an average daily yield of 12.74% per annum. Enwealth and Etica, who also joined in 2023, followed with average daily yields of 12.05% and 11.97%, respectively. Cytonn MMF and Apollo MMF closed the top five leads with average daily yields of 11.68% and 11.52%, respectively.
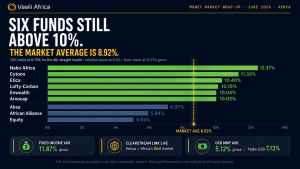
Money markets will continue to offer some of the best yields in the markets as interest rates are expected to remain elevated most of the year. To note, currently, Etica is leading the list with a daily yield of 15.87% p.a., with Lofty-Corban MMF and Nabo Africa MMF following closely with daily yields of 15.36% p.a. and 15.0%, respectively. The table below summarizes the average MMF performance in 2023 by daily average yields.
Daily Average Yields for MMFs in 2023
| No. | Fund Manager | Fund Name | Daily Average Yield |
| 1 | Lofty-Corban | Lofty-Corban Money Market Fund | 12.74% |
| 2 | Enwealth Financial Services | Enwealth Money Market Fund | 12.05% |
| 3 | Etica Capital Limited | Etica Money Market Fund | 11.97% |
| 4 | Cytonn Asset Managers Limited | Cytonn Money Market Fund | 11.68% |
| 5 | Apollo Asset Management Company Limited | Apollo Money Market Fund | 11.52% |
| 6 | GenAfrica Asset Managers Limited | GenAfrica Money Market Fund | 11.25% |
| 7 | Mayfair Asset Managers | Mayfair Money Market Fund | 10.96% |
| 8 | Madison Investment Managers Limited | Madison Money Market Fund | 10.94% |
| 9 | Jubilee Financial Services Limited | Jubilee Money Market Fund | 10.92% |
| 10 | Kuza Asset Management Limited | Kuza Money Market fund | 10.62% |
| 11 | Nabo Capital Limited | Nabo Africa Money Market Fund | 10.54% |
| 12 | Sanlam Investments East Africa Limited | Sanlam Money Market Fund | 10.45% |
| 13 | Co-op Trust Investment Services Limited | Co-op Money Market Fund | 10.45% |
| 14 | Old Mutual Investment Group | Old Mutual Money Market Fund | 10.40% |
| 15 | African Alliance | AA Kenya Shillings Fund | 10.37% |
| 16 | Genghis Capital | GenCap Hela Imara Money Market Fund | 10.36% |
| 17 | Dry Associates | Dry Associates Money Market Fund | 10.25% |
| 18 | KCB Group | KCB Money Market Fund | 10.24% |
| 19 | ICEA Asset Lion Asset Management Limited | ICEA Lion Money Market Fund | 9.67% |
| 20 | CIC Asset Managers Limited | CIC Money Market Fund | 9.65% |
| 21 | ABSA Bank | Absa Shilling Money Market Fund | 9.55% |
| 22 | Orient Asset Managers | Orient Kasha Money Market Fund | 9.33% |
| 23 | Britam Asset Managers (Kenya) Limited | British-American Money Market Fund | 8.95% |
| 24 | Equity Bank | Equity Money Market Fund | 8.40% |
| AVERAGE | 10.55% |
2. FIXED INCOME
Treasury Bills
In 2023, Treasury bills were oversubscribed, recording an oversubscription rate of 120.0%, compared to the undersubscription rate of 94.9% recorded in 2022.
The short 91-day paper had the highest demand as investors avoided duration risk resulting from an increase in interest rates. To note, an increase in interest rates reduces the value of a bond, causing a potential loss to bond holders. Additionally, the shorter the maturity of a bond, the lower the duration risk, and vice versa. The 91-day paper recorded an average oversubscription rate of 529.1%, receiving KES 1,100.5 Bn worth of bids out of the offered KES 208.0 Bn.
In reversal, the average subscription rates for 182-day and 364-day papers decreased to 47.7% and 28.7%, respectively, from 67.2% and 69.7% recorded in 2022. Out of the total KES 1,497.7 Bn worth of bids received, the government accepted KES 1,385.9 Bn, translating to an acceptance rate of 92.5%, higher than the 87.8% recorded in 2022, depicting the heightened need for financing by the government.
The T-Bills auctions saw a rise in their yields through the year, with the average yields of 91-day, 184-day, and 364-day increasing by 409.2 bps, 348.9 bps, and 293.4 bps, to 12.3%, 12.5%, and 12.8%. The graph below compares the weighted average yields on the government papers comparing 2023 and 2022:

Treasury Bonds
In 2023, T-bonds were oversubscribed, recording a subscription rate of 127.5% compared to the under-subscription rate of 94.3% in 2022, owing to the increased yields on T-bonds, averaging 15.7%, up from 13.5% in 2022. Out of the KES 836.4 Bn worth of bids received, the government accepted a total of KES 712.8 Bn, equivalent to an acceptance rate of 85.2%, marginally lower than the 84.3% recorded in 2022, as the government tried to avoid highly-priced bids.
Owing to the increased borrowing by the government and the enticing interest rates, the total domestic debt increased by 12.8% to KES 5.0 Tn at the close of 2023, up from KES 4.5 Tn recorded at the end of 2022.
T-bonds saw a 15.1% increase in the domestic debt share, while T-bills especially recorded a 17.9% cut in their share. This is due to the infrastructure bond issuances, which gained a lot of traction, in addition to a spike in interest rates, especially in the short-term bonds, which recently crossed the 18.0% mark. A summary of domestic debt composition as of December 29th 2023:
| Total Domestic Debt (KES Bns) | |||
| 2022 | 2023 | ||
| T-Bonds | 3,710.62 | 4,271.82 | 15.1% |
| T-Bills | 666.37 | 546.90 | (17.9%) |
| Overdraft at CBK | 58.50 | 94.13 | 60.9% |
| Other domestic debt | 32.76 | 126.28 | 285.5% |
| Total Domestic Debt (KES bns) | 4,468.25 | 5,039.13 | 12.8% |
To note, the demand for short-term government debt persisted as investors sought to avoid future uncertainty. Consequently, the average tenor on all issued bonds was reduced to 5.9 years from 12.4 years in 2022. Furthermore, the amount raised from the normal budgetary support bonds was reduced by 33.1%, while the average coupon rate increased to 14.9% from 12.9% in 2022. The table below is a summary of the budgetary support bonds issued in 2023:
| Issue Date | Bond Auctioned | Effective Tenor to Maturity (Years) | Coupon Rate | Amount offered (KES Bn) | Actual Amount Raised (KES Bn) | Average Accepted Yield |
| 16/01/2023 | FXD1/2020/005 (Re-opened) | 2.4 | 11.7% | 50.0 | 31.5 | 12.9% |
| FXD1/2022/015 (Re-opened) | 14.3 | 13.9% | 14.3% | |||
| 23/01/2023 | FXD1/2020/005 Tap sale | 2.4 | 11.7% | 10.0 | 17.6 | 13.9% |
| FXD1/2022/015 Tap sale | 14.3 | 13.9% | 14.2% | |||
| 13/02/2023 | FXD1/2017/10 (Re-opened) | 4.4 | 13.0% | 50.0 | 16.7 | 13.9% |
| FXD1/2023/10 | 10.0 | 14.2% | 14.2% | |||
| 20/02/2023 | FXD1/2020/005 Tap sale | 4.4 | 13.0% | 10.0 | 12.2 | 13.9% |
| FXD1/2022/015 Tap sale | 10.0 | 14.2% | 14.2% | |||
| 10/04/2023 | FXD2/2018/10 (Re-opened) | 5.7 | 12.5% | 20.0 | 3.4 | 14.4% |
| 24/04/2023 | FXD1/2022/03 (Re-opened) | 2.1 | 11.8% | 30.0 | 1.8 | 14.4% |
| 15/05/2023 | FXD1/2023/003 | 3.0 | 14.2% | 20.0 | 20.3 | 14.2% |
| 22/05/2023 | FXD1/2023/003 Tap sale | 3.0 | 14.2% | 10.0 | 10.6 | 14.2% |
| 29/05/2023 | FXD1/2023/03 Tap sale | 3.0 | 14.2% | 20.0 | 27.2 | 14.2% |
| 26/6/2023 | FXDI/2023/03 Tap sale | 3.0 | 14.2% | 15.0 | 18.6 | 14.2% |
| 17/07/2023 | FXD1/2016/10 | 3.2 | 15.0% | 40.0 | 15.7 | 16.3% |
| FXD1/2023/05 | 5.0 | 16.8% | 22.8 | 16.8% | ||
| 24/07/2023 | FXD1/2016/10 Tap sale | 3.2 | 15.0% | 20.0 | 31.2 | 16.3% |
| FXD1/2023/05 Tap sale | 5.0 | 16.8% | 12.2 | 16.8% | ||
| 21/08/2023 | FXD1/2023/02 | 2.0 | 17.0% | 40.0 | 11.7 | 17.0% |
| FXD1/2023/05 (Re-opened) | 4.9 | 16.8% | 7.5 | 18.0% | ||
| 28/08/2023 | FXD1/2023/02 Tap sale | 2.0 | 17.0% | 21.0 | 17.4 | 17.0% |
| FXD1/2023/05 Tap sale | 4.9 | 16.8% | 6.1 | 18.0% | ||
| 18/09/2023 | FXD1/2023/02 (Re-opened) | 1.9 | 17.0% | 35.0 | 15.0 | 17.5% |
| FXD1/2016/10 (Re-opened) | 2.9 | 15.0% | 6.6 | 17.9% | ||
| 02/10/2023 | FXD1/2023/02 Tap sale | 1.9 | 17.0% | 15.0 | 2.6 | 17.5% |
| FXD1/2016/10 Tap sale | 2.9 | 15.0% | 0.8 | 17.9% | ||
| 16/10/2023 | FXD1/2023/02 (Re-opened) | 1.9 | 17.0% | 35.0 | 4.8 | 17.7% |
| FXD1/2023/05 (Re-opened) | 4.8 | 16.8% | 1.5 | 18.0% | ||
| 2023 | 4.6 | 14.9% | 441.0 | 315.8 | 15.7% | |
| 2022 | 12.3 | 12.9% | 621.50 | 472.37 | 13.4% | |
| Change | (7.7) | 1.9% | (29.0%) | (33.1%) | 2.3% | |
Notably, the amount raised from the Infrastructure Bond (IFB) issues recorded a significant increase of 69.1%, while the coupon rate increased to an average of 15.8% from 13.6% in 2022. Below is a summary of 2023 IFB issues:
| Issue Date | IFB Issued | Effective Tenor Maturity (Years) | Coupon Rate | Amount Offered (KES Bn) | Actual Amount Raised (KES Bn) | Average Accepted Yield |
| 13/03/2023 | IFB1/2023/017 | 17.0 | 14.4% | 50.0 | 50.9 | 14.4% |
| 20/03/2023 | IFB1/2023/017 Tapsale | 17.0 | 14.4% | 20.0 | 12.7 | 14.4% |
| 17/04/2023 | IFB1/2023/017 Tapsale | 17.0 | 14.4% | 10.0 | 5.1 | 14.4% |
| 19/6/2023 | IFB1/2023/007 Tapsale | 7.0 | 15.8% | 60.0 | 213.4 | 15.8% |
| 13/11/2023 | IFB1/2023/6.5 | 6.5 | 17.9% | 50.0 | 67.1 | 17.9% |
| 11/12/2023 | IFB1/2023/6.5 Tapsale | 6.5 | 17.9% | 25 | 47.87 | 17.9% |
| 2023 | 11.8 | 15.8% | 215.0 | 397.0 | 15.8% | |
| 2022 | 12.7 | 13.6% | 267.80 | 234.81 | 13.6% | |
| Change | (0.8) | 2.2% | (19.7%) | 69.1% | 2.2% | |
Secondary Market Bond Turnover
During the year, activity in the secondary bond market recorded a 9.5% decline to KES 666.9 Bn from KES 736.9 Bn in 2022, which was as a result of increased interest rates in the primary market, which became a better attraction for investors. The chart below shows the total bond turnover in 2023:

As expected, the yield curve experienced an upward shift in 2023, with the short-term yields increasing at a faster pace compared to the long-term yields. This was on the back of increased borrowing by the government and investors demanding high yields owing to future uncertainty. The graph below compares the 2023 yield curve to 2022:

Kenya Eurobonds
Kenyan Eurobonds were generally on a downward trend, save for the USD 2.0 Bn June 2024 maturity. This is on the back of improved investor perceptions of Kenya owing to the country’s efforts in securing financing to repay the upcoming maturity. However, the June maturity remains very volatile and sensitive to market speculation as the maturity nears, hence the increase in the yields. The table below is a performance summary of Kenya’s Eurobonds:
| Issue Date | 2014 | 2018 | 2019 | 2021 | ||
| Tenor | 10-year issue (USD 2.0bn) | 10-year issue (USD 1.0 bn) | 30-year issue (USD 1.0 bn) | 7-year issue (USD 0.9 bn) | 12-year issue (USD 1.2 bn) | 13-year issue (USD 1.0 bn) |
| Years to maturity | 0.5 | 4.2 | 24.2 | 3.4 | 8.4 | 10.5 |
| Maturity Date | Jun-24 | Feb-28 | Feb-48 | May-27 | May-32 | Jun-34 |
| 2023 | 13.6% | 9.8% | 10.2% | 10.1% | 9.9% | 9.5% |
| 2022 | 12.9% | 10.5% | 10.9% | 10.9% | 10.8% | 9.9% |
| Change | 0.7% | (0.7%) | (0.7%) | (0.8%) | (0.9%) | (0.3%) |
3. EQUITIES
In 2023, the Kenyan stock market was on a downward trend, with NASI, NSE 20, and NSE 25 losing significantly by 27.7%, 10.4%, and 24.0%, respectively. The loss was fueled by losses recorded by major stocks like KCB, Safaricom, and EABL of 42.9%, 42.2%, and 32.9%, respectively.
However, the losses were offset by gains recorded by other major stocks such as Bamburi, Stanchart, and Stanbic of 14.0%, 11.7%, and 6.6%, respectively.

Key to note: the Nairobi Securities Exchange (NSE) introduced two new indices in 2023, the NSE 10, effective September 4th 2023, to monitor the equity market, comprising Safaricom, Equity, KCB, Co-operative Bank, ABSA, EABL, NCBA, KENGEN, Kenya Re, and Centum.
The constituent stocks are to be reviewed semi-annually based on market cap methodology. On a since-inception basis, the NSE 10 recorded a 9.2% loss to close the year at KES 907.50 from a KES 1000.00 inception price. NSE also introduced the NSE Bond Index (NSE BI), which is meant to track bond market performance.
The table below shows the share price performance of the top listed companies by market cap as of the end of 2023:
| Performance of Top 10 Companies in 2023 | ||
| No | Company | Share Price Performance 2023 |
| 1 | Safaricom | (42.2%) |
| 2 | Equity Group | (25.3%) |
| 3 | EABL | (32.9%) |
| 4 | KCB | (42.9%) |
| 5 | NCBA | 0.0% |
| 6 | ABSA Bank | (6.1%) |
| 7 | Standard Chartered | 11.7% |
| 8 | Co-operative | (5.8%) |
| 9 | Stanbic | 6.6% |
| 10 | BAT | (11.4%) |
In 2023, foreign investors exhibited a bearish sentiment towards key blue-chip stocks, resulting in a net outflow of USD 296.3 million for the year. Likewise, the total equity turnover for the year decreased by 18.3% to USD 649.1 million from the USD 794.7 million recorded in 2022, with Safaricom emerging as the most traded counter, accounting for 39.7% of the overall market activity.
The negative performance in the equities market was a result of capital flight as investors sought less risky markets. Additionally, the increase in local interest rates saw investors move from equities and increase their holdings in Treasury bills and bonds.
The tables below show the top gainers and losers in 2023:
| Top 5 Gainers in 2023 | |||
| Company | Year Open price | Closing price | %Change |
| Umeme | 7.48 | 16.00 | 113.9% |
| Kenya Orchards | 10.40 | 19.50 | 87.5% |
| Kapchorua Tea | 115.75 | 215.00 | 85.7% |
| Eveready East Africa | 0.72 | 1.16 | 61.1% |
| Eaagads | 10.50 | 13.95 | 32.9% |
| Top 5 Losers in 2023 | |||
| Company | Year Open price | Closing price | %Change |
| Car&General | 49.00 | 25.00 | (49.0%) |
| Trans-Century | 0.99 | 0.52 | (47.5%) |
| Unga Group | 32.00 | 16.85 | (47.3%) |
| KCB Group | 38.35 | 21.90 | (42.9%) |
| Safaricom | 24.05 | 13.90 | (42.2%) |
4. REAL ESTATE
During the year, the real estate sector had a rebound in growth from the 4.5% experienced in 2022 to an average of 5.7% for the first three quarters of the year, owing to government support through affordable housing, infrastructure development, and efforts made to avail more sustainable and affordable financing to the sector through SACCOS and banks. A summary of growth in the sector:

REITS
REITS performance in Kenya remained relatively dull in 2023, with the ILAM Fahari I-REIT closing the year at an average price of KES 6.3%, a 7.1% loss from the KES 6.8 per share recorded during the start of the year, and the dividend yield at 10.3%.
Notably, during the year, the Capital Markets Authority (CMA) accepted the ILAM Fahari I-REIT’s restructuring offer involving converting its unrestricted Income Real Estate Investment Trust (IFIR) into a restricted I-REIT. This was meant to offer more specialized investment opportunities to professional investors, while non-professional investors were allowed to redeem their units at an offer price of KES 11.0 per unit. The I-REIT resumed trading at the NSE on October 25th 2023, after the conversion period elapsed, and continues to trade in the main investment section as it awaits delisting, which was slated for December 4th 2023.
Additionally, LAPTRUST Imara I-REIT was listed by the NSE as the first I-REIT issued by a Pension fund, the Local Authorities Pension Trust (LAPTRUST). The I-REIT operates as a closed-ended fund and is listed on the restricted sub-segment of the NSE. Also, the price has been locked at KES 20.0, which is based on the net asset value (NAV), until March 2026, when the REIT will start trading freely, subject to forces of supply and demand, like the other REITS. After 2026, LAPTRUST (pension fund) will then offload part of its stake (currently at 99.9%) to only professional investors with a probable minimum trade size of KES 5.0 million.
On the other hand, the unquoted Acorn D-REIT and I-REIT closed the year trading at KES 25.3 and KES 21.7 per unit, marking gains of 6.3% and 3.8% during the year, respectively.
The REITS performance remains dull, mainly due to the steep requirements as well as limited knowledge among investors. One of the key limitations remains, especially on the D-REITS, the high base investment minimum currently set at KES 5.0M, which discourages potential investors. The CMA should focus on decreasing the high financial barriers and educating investors about the potential benefits of REITS in enhancing portfolio diversification.
Land Sector
In the Nairobi area, land rates recorded an average 1.2% increase in price per acre, averaging at KES 110.9M from KES 109.6M in 2022, while the average capital appreciation averaged at 3.0%.
The positive performance was mainly on the back of the 5.5% capital appreciation recorded in the Nairobi Satellite towns, owed to the improved infrastructure extended to these towns like the Nairobi Express Way, the Southern and Eastern Bypass, great schools, hospitals, and malls that attract families. The table below shows a summary of the average price per acre in the Nairobi suburbs and the satellite towns:
| Land Prices (KES in Millions) | |||
| 2022 | 2023 | Capital Appreciation (%) | |
| Nairobi Suburbs | 193.5 | 194.7 | 0.6% |
| Nairobi Satellite Towns | 25.6 | 27.0 | 5.5% |
| AVERAGE | 109.6 | 110.9 | 3.0% |
In our selected focus, Ngong led in satellite capital appreciation, with land prices per acre increasing by 16.0% year over year owing to improved infrastructure like the Southern By-pass, while Syokimau came in second at 9.5%, mostly attributable to the Nairobi Expressway. The table below is a summary of the performance in Nairobi Satellite towns in terms of capital appreciation:
| Nairobi Satellite Land Prices Per Acre (KES in Millions) | |||
| 2022 | 2023 | Capital Appreciation(%) | |
| Ngong | 28.8 | 33.4 | 16.0% |
| Syokimau | 28.3 | 31.0 | 9.5% |
| Athi River | 16.9 | 18.4 | 8.9% |
| Kitengela | 14.6 | 15.6 | 6.8% |
| Tigoni | 29.3 | 30.7 | 4.8% |
| Ruiru | 28.3 | 29.5 | 4.2% |
| Juja | 18.7 | 19.2 | 2.7% |
| Ruaka | 98.4 | 99.7 | 1.3% |
| Rongai | 25.4 | 25.5 | 0.4% |
In the Nairobi Suburbs areas, Lang’ata had the highest capital appreciation y/y at 9.1% owing to its central location and easy access to several places, as well as a lower price compared to its neighborhoods like Karen.
However, in the Nairobi high-end suburbs like Kileleshwa and Kitusuru recorded a decline in prices per acre y/y owing to oversupply, with Nyari registering the highest decline of 2.4%. Likewise, the Nairobi suburbs commercial zones like Westlands, Upperhill, and Kilimani had a negative capital appreciation due to perceived oversupply, with Upperhill having the widest decline of 1.6%. The table below shows the performance of the Nairobi Suburbs land price per acre:
| Nairobi Suburbs Land Prices Per Acre (KES in Millions) | |||
| 2022 | 2023 | Capital Appreciation (%) | |
| Langata | 72.3 | 78.9 | 9.1% |
| Loresho | 95.5 | 102.8 | 7.6% |
| Donholm | 73.7 | 77.8 | 5.6% |
| Parklands | 402.1 | 405.6 | 0.9% |
| Westlands | 449.4 | 452.4 | 0.7% |
| Karen | 65.4 | 65.7 | 0.5% |
| Kitisuru | 95.0 | 94.8 | (0.2%) |
| Kilimani | 399.7 | 398.5 | (0.3%) |
| Gigiri | 235.2 | 234.4 | (0.3%) |
| Upperhill | 491.0 | 482.9 | (1.6%) |
| Kileleshwa | 298.0 | 292.0 | (2.0%) |
| Nyari | 113.5 | 110.8 | (2.4%) |
5. GLOBAL MARKETS
Equities
In 2023, the Equities markets in the USA, Japan, the UK, and the Eurozone at large remained resilient enough to experience a significant surge in major indices despite global volatility, inflation, and elevated interest rates.
The tech-focused NASDAQ led the way in total gain, recording a 43.4%, followed by the S&P 500 and Dow Jones at 24.2% and 13.8%, respectively. The outstanding performance in the US equities markets was on the back of gains recorded by the major stocks, including the “Magnificent Seven,” that is, Apple, Amazon, Alphabet, Meta Platforms, Microsoft, Nvidia, and Tesla, who jointly contributed about 70.0% of the total S&P 500 total year gains. To note, the information technology and communication services sectors demonstrated robust performance during the period.
Likewise, the Japanese equities market was favored by policy initiatives by the government and the Tokyo Stock Exchange, meant to improve corporate governance and capital efficiency, and also by the shift to inflation from deflation, making the equities markets more attractive. Owing to this, NIKKEI 225 gained 30.1% as a result of gains recorded by major stocks such as Toyota Motor Corporation, Sony Group, and Nippon Telegraph Corporation.
Similarly, equities markets in the Eurozone and the UK performed well, with DAX and FTSE 100 gaining by 20.3% and 3.8%, respectively, mainly on the back of economic recovery in their major export markets like the USA and China, resulting in a good recovery in most of the sectors.
However, the UK markets were weighed down by the economic slowdown, political volatility, and increasing investor pessimism, mainly attributed to the Middle East unrest. The table below is a summary of the performance of major global indices:
| Index | S&P 500 | NASDAQ | FTSE 100 | NIKKEI 225 | DOW JONES | DAX |
| 2022 | 3839.5 | 10468.5 | 7451.7 | 25716.9 | 33147.3 | 13923.6 |
| 2023 | 4769.8 | 15011.4 | 7733.2 | 33464.2 | 37711.0 | 16751.6 |
| %Change | 24.2% | 43.4% | 3.8% | 30.1% | 13.8% | 20.3% |
In the Sub-Saharan region (Africa), equities markets remained subdued, with the majority of the indexes recording losses on the back of inflationary pressures, currency depreciation, and capital flight, mainly attributable to increased interest rates in more developed economies like the US, making the developed markets more attractive.
Notably, NASI was the biggest loser in the market, losing by 42.8% on a dollarized basis. Some of the gainers in the SSA region were the Nigeria All Share Index (NG ALSI), the Johannesburg All Share Index (JALSH), and the Zambia All Share Index (LuSE).
Commodities
In 2023, the S&P GSCI, which tracks commodity prices across the energy, industrial, metals, livestock, and agriculture sectors, faced headwinds on the back of the Ukraine conflict that threatened the supply and security of natural gas, a weak economic recovery in China (the second-largest economy), as well as financial stress.
During the period, energy was the poorest performer, shedding 18.9%, with natural gas prices declining sharply to shed a total of 44.0% during the year and crude oil declining by 8.3%. This was as a result of easing supply chain constraints caused by the Ukraine war, the USA offsetting the supply shortage by becoming the largest oil producer currently, and an anticipated low demand from China, which kept the prices low.
Precious metals recorded a positive performance in 2023, with an average gain of 8.5%, with gold recording an exemplary performance, gaining by 12.9%. This was mainly on the back of investors rushing to invest in gold as a safe haven amid global volatility and geopolitical risks.
Currency
Despite the weakening of the Kenyan Shilling against the Dollar, having shed 26.3% against the dollar, the US dollar exhibited weakness against a basket of major currencies, with the U.S. Dollar index (DXY) recording a 2.1% decline for the year. This was primarily on the back of a slowdown in the US economy, which reduced the attractiveness of the dollar as a reserve currency, as well as geopolitical risks that increased the demand for safe haven commodities like gold.
Notably, among major currencies, the US dollar declined against the Sterling Pound and the Euro by 2.9% and 0.8%, respectively. However, the dollar registered gains against major currencies like the Japanese Yen, Australian dollar, and New Zealand dollar, gaining by 10.9%, 4.9%, and 3.1%, respectively, as well as against many frontier and emerging market currencies, having gained against the Kenyan Shilling by 21.1%.
Interest Rates
In 2023, global interest rates stayed elevated, influenced by inflationary pressure, which necessitated major central banks raising borrowing costs despite signs of falling demand and threats of falling into recession.
The Fed raised its interest rate thrice in 2023, by a total of 75 bps, with the latest decision coming in December to maintain a range of 5.25%–5.5%, a two-decade high, despite decreased inflation to 3.4% in December 2023 from 6.5% in December 2022.
Similarly, the European Central Bank (ECB) hiked its rate by a total of 150 bps in 2023 to close the year at 4.0% from 2.5% recorded at the beginning of the year. Elsewhere, the Bank of England raised its interest rates by a total of 175 bps to close the year at 5.25%, from 3.5% in Dec 2022. The three major economies have been in a race against inflationary pressures, to bring down inflation to the desired target of 2.0%.
In the fixed income sector, Eurozone recorded the highest jump, with the yield of the 10-year bond increasing by 2.0% points, to close the year at 4.5% from the 2.5% recorded at the end of 2022, owing to the strong increase of 150bps in the central bank rate. The US 10-year bond yield increased marginally by 0.25% points to close the year at 3.87%, in support of the general market trend of reduced interest rates in the year as market conditions eased, and reduced inflation, pointing towards a decrease in the central bank rates. The chart below compares 10-year bond yields in 2023 from 2022:

To highlight, most investment funds in Kenya offering offshore investments recorded a robust performance in 2023 owing to a remarkable year in the global markets.
Mansa X (KES) and Mansa X (USD), offered by Standard Investment Bank (SIB), posted a net return of 18.01% and 12.10%, respectively, in 2023, up from 15.59% and 10.08% (annualized) in 2022.
Notably, Europe had the highest geographical spread in investments, followed by the Americas and Africa, while Eurobonds had the highest asset class share, with an exposure of over 25.0% in both funds. Other fund managers operating offshore investments in Kenya include Dry Associates Investment Bank and Stanchart.
2024 MARKET OUTLOOK
For 2024, in the local markets, we expect interest rates to remain elevated in the short to medium term on the back of heightened borrowing by the government to pay the upcoming debt maturities as well as fund its widening budget deficit, currently projected at 5.5% of GDP, up from the prior June estimate of 4.4% of GDP for FY’2023/24.
Additionally, the increased economic uncertainty with the upcoming USD 2.0 Bn June maturity will push investors to continue attaching higher risk to government borrowing, hence demanding high yields. The inverted yield curve is set to dominate 2024, as yields on the short-term papers are expected to grow at a faster pace than the long-term papers, owing to investors remaining risk-averse to long-dated government papers.
It is also expected that the Central Bank of Kenya (CBK) will not ease its monetary policies in early 2024; hence, we don’t expect a rate decrease in the first half of the year owing to the continued free fall of the Kenyan Shilling against major currencies. To note, the rate increase in December to 12.5% was mainly to aid in stabilizing the Kenyan Shilling, and hence the CBK would want to hold on to see the results of the policy in taming the shilling exchange rate. Additionally, inflation remains high in the country, above the CBK’s preferred target of 5.0%, coming in at 6.6% in December, but within the CBK’s preferred range.
The yields on the Kenyan Eurobonds are also poised to decline mostly in the second half of 2024 if Kenya honors the June maturity, which is set to reduce the investor risk attached to Kenya. Additionally, Kenya is likely to issue a new Eurobond to source extra financing and top up its dwindling foreign reserves, mainly after the global market interest rates ease.
The domestic equities market is likely to stay subdued in the first half of the year owing to the tough operating environment and high interest rates in developed economies, leading to capital flight as investors seek less risky markets. However, we remain ‘bullish’ in the long term as the market is currently undervalued with a PEG ratio of 0.7x, and a lower market P/E of 5.1x, which is 57.7% below the historical average of 12.1x. Hence, investors should invest in stocks with a strong and consistent earnings growth as there is potential to perform well.
Likewise, the Real Estate sector is likely to face more headwinds in 2024 resulting from the continued increase in construction cost as most raw materials prices continue soaring high on the back of the shilling depreciation. Additionally, existing oversupply in some areas, and the elevated cost of borrowing will continue limiting access to funding, and downgrading the optimal earnings in the sector. Investors should favor investing in the Nairobi Satellite towns which have stayed resilient in capital appreciation and have proven to offer family-friendly environment, adding to the infrastructure extension to these areas
In the SSA (Sub-Saharan Africa) region, inflation is set to persist during the year owing to cost-push inflation mainly on the back of elevated import bills due to domestic currency depreciation. To note, inflation in the Sub-Saharan region is rarely domestic-demand driven, but it is mainly fueled by global instabilities, supply chain constraints and weak domestic currencies. As such, interest rates are set to remain elevated in most sovereigns in the region. Similarly, we expect many equities markets in the region to continue experiencing net foreign outflows due to economic downturns especially in the first half of the year, before most economies start benefiting from global stability. The key solution remains to be fiscal consolidation by the governments, cut down on spending and debt appetite, as well as put in place measures to increase foreign direct investments. This will in turn cut the high demand on the foreign currency, hence stabilizing the local currency.
Additionally, we expect to see new Eurobond issues in the SSA region, after the region got locked out of the international capital markets in 2023 due to hiked interest rates in the developed economies coupled with investors demanding high interest rates, owing to poor economic performance and inflationary pressures in the region. To note, Ivory Coast is expected to issue a USD 1.0 – USD 1.25 Billion Eurobond soon, setting the 2024 stage in the international capital markets.
In the global markets, we anticipate a better year compared to 2023, owing to the reduced global inflation, with the biggest economies like U.S, UK and the Eurozone almost achieving their 2.0% inflation rate target. We therefore anticipate the Fed to start easing on the monetary policies during the year, probably in the first half, which will fuel investments in the economy.
The equities market is poised for more growth, fueled by an anticipated decrease in the cost of funding and cost of doing business as a result of lower interest rates. AI stocks are set to remain in the front line in gains, as demand for artificial intelligence solutions is set to increase during the year across all sectors. However, there is a threat to global inflation going up mainly on the back of the Middle East unrest, which could disrupt supply chains, if not well contained.