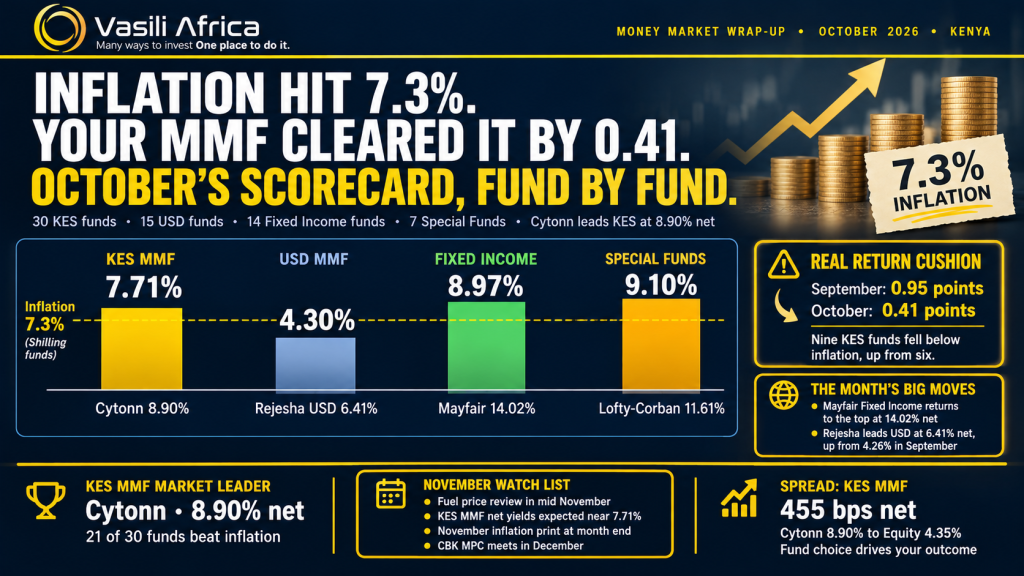
October was a month of sharp contradictions. Businesses had their best stretch of the year, shoppers felt the squeeze at the pump and the supermarket till, and the Nairobi Securities Exchange gave back a good part of its value. Through all of it, the money market and fixed income funds went on doing their steady job. Below, we show who led, who lagged and what to watch in November.
The Month in Brief: Three Forces Behind Your Returns
- Private sector high (PMI): The Stanbic Bank Kenya PMI climbed to 52.5, up from 51.3 in September and the strongest reading of 2026. It is a monthly mood check on Kenyan firms: anything above 50 means business conditions are improving. October was the month that the financial mood turned properly upbeat.
- Inflation at a peak: Annual inflation rose to 7.3% from 6.8%, its highest since June 2023 and only 0.2 points shy of the 7.5% ceiling of CBK’s target band. Two things were the key drivers:
- Transport costs jumped on higher fuel prices
- Food followed, with core grocery items under strain and fresh produce prices surging. Inflation is the quiet tax on savings: a fund earning less than 7.3% is losing purchasing power.
In short: the story of October is the inflation peak. It has pushed up the cost of living and left savers keeping less of every shilling they earn.
| 7.71% KES money market funds, average net | 8.97% Fixed income funds, average net | 9.10% Special funds, average net | 4.30% USD money market funds, average net | 7.3% Annual inflation, October |
Averages are daily cumulative averages, net of tax. Inflation as reported for October 2026.
| How to read the numbersAverage yield is the headline rate a fund earned over the month, before tax. Net return is what lands in your pocket after 15% withholding tax on the interest. Fund managers advertise the first number; your bank balance reflects the second. Past performance is a useful guide, not a promise. |
The Scorecard: Four Fund Families, One Picture
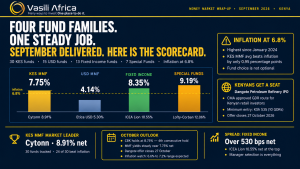
Special funds led on yield again, with fixed income funds close behind and shilling money market funds third. Fixed income made the biggest move of the month, with its average net return rising to 8.97% from 8.35% in September. Shilling money market funds slipped slightly, from 7.75% to 7.71%, while dollar funds edged up from 4.14% to 4.30%. Dollar funds sit lower because dollar interest rates are lower than shilling ones. That is not a weakness; it is a different job in a different currency.
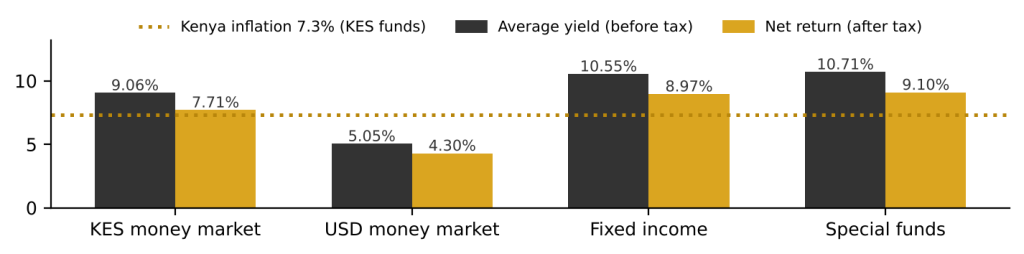
Figure 1: Average yield versus net return after tax, by fund category, October 2026. The inflation line is relevant to shilling funds only.
The practical takeaway: after tax, the average shilling money market fund beat inflation by just 0.41 percentage points (7.71% against 7.3%). In September that cushion was 0.95 points. It is getting thin, which is why picking the right fund inside a category matters as much as picking the category.
Kenya Shilling Money Market Funds
Cytonn Money Market Fund held the top spot with an average yield of 10.47% and 8.90% after tax. Faulu (8.75%) was next, followed by Lofty-Corban (8.55%), Orient Kasha (8.52%) and Nabo Africa (8.51%). The category’s daily cumulative average was 9.06% before tax and 7.71% after. Eighteen of the 30 funds finished at or above the average and 21 beat inflation, down from 24 in September. The nine that did not were Genghis (7.23%), CPF (6.98%), CIC (6.89%), Mayfair (6.71%), African Alliance Kenya (6.63%), Co-op (6.58%), ICEA Lion (6.51%), Absa Shilling Fund (5.87%) and Equity (4.35%). The gap between first and last was 4.55 points. Fund choice, not just category, drives your outcome.
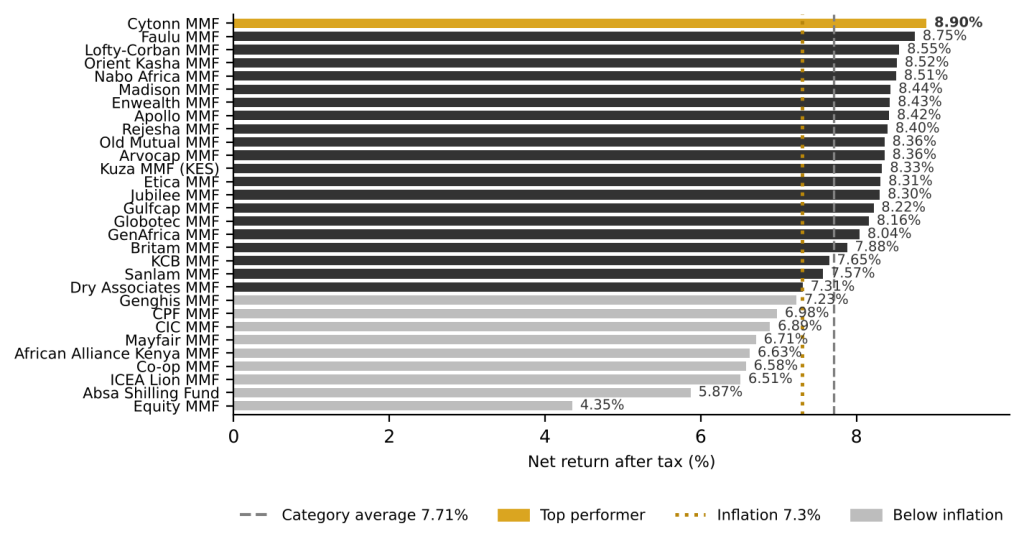
Figure 2: KES money market fund net returns after tax, October 2026. Yellow marks the top performer; grey bars fell short of 7.3% inflation.
| # | Fund Manager | Fund Name | Average Yield (%) | Net Return After Tax (%) |
|---|---|---|---|---|
| 1 | Cytonn Asset Managers Limited | Cytonn Money Market Fund | 10.47 | 8.90 |
| 2 | Faulu Microfinance Bank | Faulu Money Market Fund | 10.30 | 8.75 |
| 3 | Lofty-Corban Investments Limited | Lofty-Corban Money Market Fund | 10.05 | 8.55 |
| 4 | Orient Asset Managers | Orient Kasha Money Market Fund | 10.02 | 8.52 |
| 5 | Nabo Capital Limited | Nabo Africa Money Market Fund | 10.01 | 8.51 |
| 6 | Madison Investment Managers Limited | Madison Money Market Fund | 9.93 | 8.44 |
| 7 | Enwealth Financial Services | Enwealth Money Market Fund | 9.92 | 8.43 |
| 8 | Apollo Asset Management Company Limited | Apollo Money Market Fund | 9.91 | 8.42 |
| 9 | Capital A Investment Bank | Rejesha Money Market Fund | 9.88 | 8.40 |
| 10 | Old Mutual Investment Group | Old Mutual Money Market Fund | 9.84 | 8.36 |
| 11 | Arvocap Asset Managers Ltd | Arvocap Money Market Fund | 9.84 | 8.36 |
| 12 | Kuza Asset Management Limited | Kuza Money Market Fund (KES) | 9.79 | 8.33 |
| 13 | Etica Capital Limited | Etica Money Market Fund | 9.78 | 8.31 |
| 14 | Jubilee Financial Services Limited | Jubilee Money Market Fund | 9.77 | 8.30 |
| 15 | Gulfcap Investment Bank | Gulfcap Money Market Fund | 9.67 | 8.22 |
| 16 | Globetec Asset Managers Limited | Globotec Money Market Fund | 9.60 | 8.16 |
| 17 | GenAfrica Asset Managers Limited | GenAfrica Money Market Fund | 9.46 | 8.04 |
| 18 | Britam Asset Managers (Kenya) Limited | Britam Money Market Fund | 9.27 | 7.88 |
| 19 | KCB Group | KCB Money Market Fund | 9.00 | 7.65 |
| 20 | Sanlam Investments East Africa Limited | Sanlam Money Market Fund | 8.90 | 7.57 |
| 21 | Dry Associates | Dry Associates Money Market Fund | 8.60 | 7.31 |
| 22 | Genghis Capital | Genghis Money Market Fund | 8.51 | 7.23 |
| 23 | CPF Asset Managers | CPF Money Market Fund | 8.22 | 6.98 |
| 24 | CIC Asset Managers Limited | CIC Money Market Fund | 8.10 | 6.89 |
| 25 | Mayfair Asset Managers | Mayfair Money Market Fund | 7.89 | 6.71 |
| 26 | African Alliance KE Asset Managers | African Alliance Kenya Money Market Fund | 7.80 | 6.63 |
| 27 | Co-op Trust Investment Services Limited | Co-op Money Market Fund | 7.74 | 6.58 |
| 28 | ICEA Lion Asset Management Limited | ICEA Lion Money Market Fund | 7.66 | 6.51 |
| 29 | Absa Bank | Absa Shilling Fund MMF | 6.90 | 5.87 |
| 30 | Equity Bank | Equity Money Market Fund | 5.12 | 4.35 |
| Daily Cumulative Average | 9.06 | 7.71 | ||
US Dollar Money Market Funds
Rejesha led the dollar category with 7.54% before tax (6.41% net), a big step up from 4.26% net in September. Etica MMF USD followed at 5.37% net and Cytonn at 5.04%. The category averaged 5.05% gross and 4.30% net. Seven of the 15 funds finished at or above the average, and the distance from the leader to NCBA at the bottom (2.86% net) was a wide 3.55 points. Dollar funds are best seen as a diversifier, a way to hold part of your savings in a second currency rather than a bet on the exchange rate.
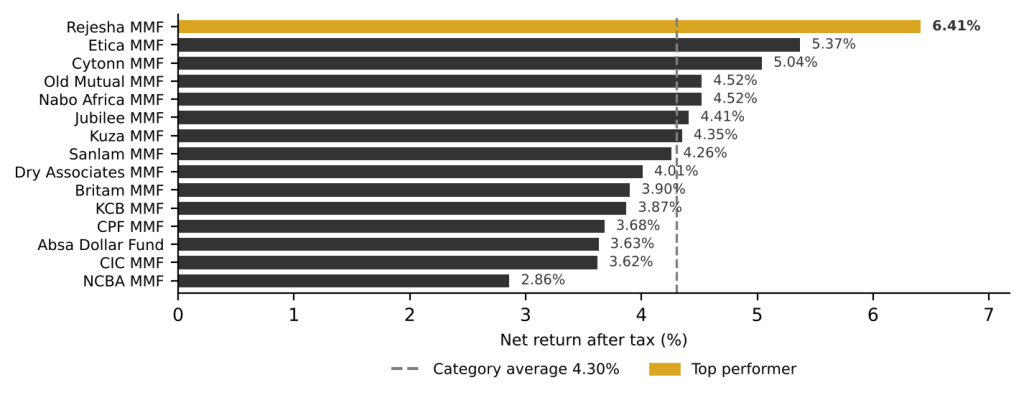
Figure 3: USD money market fund net returns after tax, October 2026.
| # | Fund Manager | Fund Name | Average Yield (%) | Net Return After Tax (%) |
|---|---|---|---|---|
| 1 | Capital A Investment Bank | Rejesha Money Market Fund USD | 7.54 | 6.41 |
| 2 | Etica Capital Limited | Etica MMF USD | 6.31 | 5.37 |
| 3 | Cytonn Asset Managers Limited | Cytonn Money Market Fund USD | 5.93 | 5.04 |
| 4 | Old Mutual Investment Group | Old Mutual Money Market Fund USD | 5.32 | 4.52 |
| 5 | Nabo Capital Limited | Nabo Africa Money Market Fund USD | 5.31 | 4.52 |
| 6 | Jubilee Asset Management Limited | Jubilee MMF USD | 5.18 | 4.41 |
| 7 | Kuza Asset Management Limited | Kuza Money Market Fund USD | 5.11 | 4.35 |
| 8 | Sanlam Investments East Africa Limited | Sanlam Money Market Fund USD | 5.02 | 4.26 |
| 9 | Dry Associates Investment Bank | Dry Associates Money Market Fund USD | 4.71 | 4.01 |
| 10 | Britam Asset Managers (Kenya) Limited | Britam Money Market Fund USD | 4.58 | 3.90 |
| 11 | KCB Group | KCB Money Market Fund USD | 4.55 | 3.87 |
| 12 | CPF Asset Managers | CPF Money Market Fund USD | 4.33 | 3.68 |
| 13 | Absa Bank | Absa Dollar Fund MMF USD | 4.28 | 3.63 |
| 14 | CIC Asset Managers Limited | CIC Money Market Fund USD | 4.26 | 3.62 |
| 15 | NCBA Investment Bank Limited | NCBA Money Market Fund USD | 3.36 | 2.86 |
| Daily Cumulative Average | 5.05 | 4.30 | ||
Fixed Income Funds
Fixed income funds invest mainly in government and corporate bonds. They usually pay more than money market funds, but returns can move around more because bond prices change daily. Mayfair Fixed Income Fund stood out at 16.50% before tax (14.02% net), the highest net return in this report. ICEA Lion (10.86% net), Zimele (10.07%) and African Alliance Kenya (9.65%) completed the leading four. The category averaged 10.55% gross and 8.97% net. Seven of the 14 funds out-earned the best shilling money market fund (8.90% net) and 12 of 14 beat inflation. The flip side is the range: the top fund earned more than double the bottom one, NCBA, at 5.91% net.
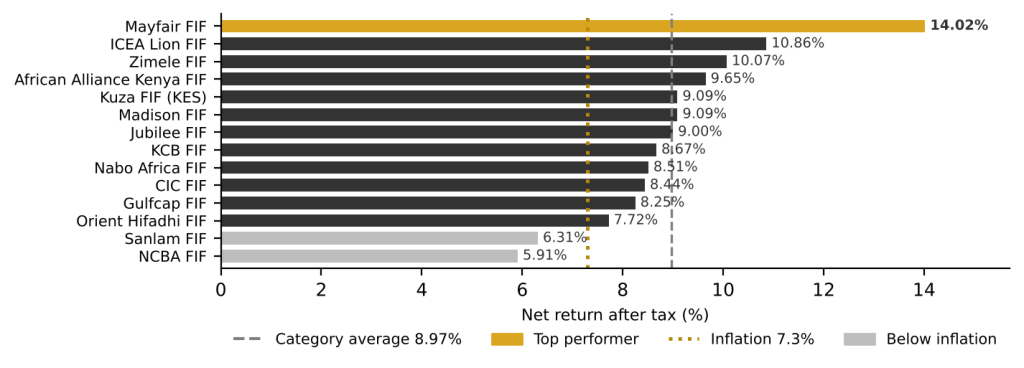
Figure 4: Fixed income fund net returns after tax, October 2026.
| # | Fund Manager | Fund Name | Average Yield (%) | Net Return After Tax (%) |
|---|---|---|---|---|
| 1 | Mayfair Asset Managers | Mayfair Fixed Income Fund | 16.50 | 14.02 |
| 2 | ICEA Lion Asset Management Limited | ICEA Lion Fixed Income Fund | 12.78 | 10.86 |
| 3 | Zimele Asset Management | Zimele Fixed Income Fund | 11.84 | 10.07 |
| 4 | African Alliance KE Asset Managers | African Alliance Kenya Fixed Income Fund | 11.35 | 9.65 |
| 5 | Kuza Asset Management | Kuza Fixed Income Fund (KES) | 10.70 | 9.09 |
| 6 | Madison Asset Managers | Madison Fixed Income Fund | 10.70 | 9.09 |
| 7 | Jubilee Financial Services Limited | Jubilee Fixed Income Fund | 10.59 | 9.00 |
| 8 | KCB Group | KCB Fixed Income Fund | 10.20 | 8.67 |
| 9 | Nabo Asset Managers | Nabo Africa Fixed Income Fund | 10.02 | 8.51 |
| 10 | CIC Asset Managers Limited | CIC Fixed Income Fund | 9.92 | 8.44 |
| 11 | Gulfcap Investment Bank | Gulfcap Fixed Income Fund | 9.71 | 8.25 |
| 12 | Orient Asset Managers | Orient Hifadhi Fixed Income Fund | 9.08 | 7.72 |
| 13 | Sanlam Investments East Africa Limited | Sanlam Fixed Income Fund | 7.43 | 6.31 |
| 14 | NCBA Investment Bank Limited | NCBA Fixed Income Fund | 6.95 | 5.91 |
| Daily Cumulative Average | 10.55 | 8.97 | ||
Special Funds
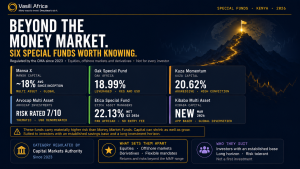
Special funds are the specialists: private debt, high-yield strategies and fixed-term products. They tend to pay more, and they ask for something in return, such as longer lock-in periods or more risk. Lofty-Corban Private Debt Fund led the category at 13.66% before tax and 11.61% net, down from 12.06% in September. Dry Associates Special High Yield Fund followed at 9.95% net, then Madison Wealth Fund at 9.54%. The category averaged 10.71% gross and 9.10% net, and all seven funds beat inflation. In the Britam Special Fixed Income range, the longer you commit, the more you earn: the 3-month, 6-month and 1-year versions returned 7.91%, 7.92% and 8.07% net. The reward for patience is real, but small.
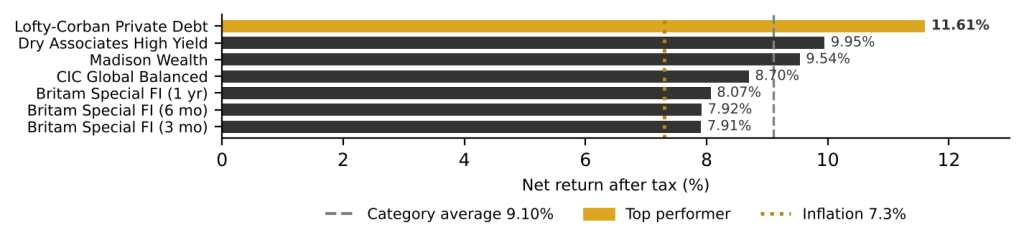
Figure 5: Special fund net returns after tax, October 2026.
| # | Fund Manager | Fund Name | Average Yield (%) | Net Return After Tax (%) |
|---|---|---|---|---|
| 1 | Lofty-Corban Asset Management | Lofty-Corban Private Debt Fund | 13.66 | 11.61 |
| 2 | Dry Associates Investment Bank | Dry Associates Special High Yield Fund | 11.70 | 9.95 |
| 3 | Madison Asset Managers | Madison Wealth Fund | 11.22 | 9.54 |
| 4 | CIC Asset Managers Limited | CIC Global Balanced Fund | 10.24 | 8.70 |
| 5 | Britam Asset Managers (Kenya) Limited | Britam Special Fixed Income Fund (1 year) | 9.50 | 8.07 |
| 6 | Britam Asset Managers (Kenya) Limited | Britam Special Fixed Income Fund (6 months) | 9.32 | 7.92 |
| 7 | Britam Asset Managers (Kenya) Limited | Britam Special Fixed Income Fund (3 months) | 9.30 | 7.91 |
| Daily Cumulative Average | 10.71 | 9.10 | ||
In the News: M-Pesa Is Kenya’s Strongest Consumer Brand
The mobile money platform has topped the 2026 Super brands East Africa consumer research in Kenya. In a survey of 2,250 users covering more than 1,900 brands across 110 categories, M-Pesa came first and parent company Safaricom second.
The picture across the region was just as telling. In Tanzania, M-Pesa ranked sixth, behind other well known companies like Airtel.
| Why it matters Mobile money has grown well beyond sending money home. It now carries payments, savings, credit and business transactions, and it sits comfortably next to household names in telecoms, food and entertainment. For savers, that means the phone in your pocket is fast becoming the front door to your financial life. |
What to Expect in November 2026
VIEWS BELOW ARE DIRECTIONAL, NOT GUARANTEED
- Fuel: relief is on the way. After an October price review that pushed inflation to 7.3%, the Treasury Cabinet Secretary said the government deliberately held back stabilisation funds to use in the mid-November review.
- Money market yields: flat, with a real return upside. CBK held its rate at 8.75% in October and the next meeting is in December, so it is expected November net yields to stay close to October’s 7.71%. If fuel relief drags inflation down from 7.3%, the real return after inflation widens again and savers get a healthier cushion. A November switch auction from CBK should also keep fund managers busy rebalancing short-term paper.
- The NSE: a bank takeover and a dividend calendar. Nedbank Group has taken a 66% controlling stake in NCBA Group in a block trade that pushed one day’s turnover to KSh107.7 billion. The markets are expected to keep reacting as Nedbank’s plans for NCBA’s dividends and expansion become clearer. Dividend books close for ALP Industrial REIT (18th November), TRIFIC Green USD I-REIT (20th November) and Kenya Power (27th November).
- Growth: optimism with a caveat. October’s PMI has left businesses planning rollouts and expansion. Official forecasts still differ, with CBK at 5.0% growth for 2026 and the World Bank at 4.6%, citing rising debt servicing costs.
The November watch list
| When | What | Why it matters |
| Every Thursday | Treasury bill auctions | Set the tone for money market yields. |
| Mid-November | Fuel price review | Government subsidy could cool transport costs and inflation. |
| November | CBK switch auction | Shows how managers reposition short-term paper. |
| 18th, 20th, 27th Nov | Dividend books close | ALP Industrial REIT, TRIFIC Green USD I-REIT and Kenya Power. |
| End of November | November inflation (KNBS) | Shows whether 7.3% was the peak. |
| December | Next CBK MPC meeting | Sets direction for yields into year-end. |
Our House View: Keep your savings spread across currencies and asset types, watch fund fees closely because they add up more than most people expect, and treat any single month’s rankings as one data point rather than a conclusion.
This report is produced by Vasili Africa for informational purposes only and does not constitute investment advice. Past performance is not indicative of future results. Fund figures are net of an assumed withholding tax of 15% and sourced from fund manager disclosures for October 2026. Macro data: KNBS, CBK, Stanbic Bank Kenya PMI (S&P Global), Nairobi Securities Exchange, National Treasury and Superbrands East Africa.