September 2026 Performance Review
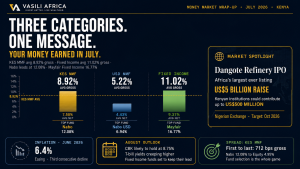
September had the energy of a Nairobi roundabout at five o’clock: plenty of movement, a few near misses, and everyone reading the same signs differently. Equities swung hard, inflation edged up again and the Central Bank held its nerve, while the quieter world of money market and fixed income funds went on doing its steady job. Below, we show who led, who lagged and what to watch in October.
The Month in Brief: Three Forces Behind Your Returns
- Private sector rebound (PMI): The Stanbic Bank Kenya PMI rose to 51.3 from 49.7 in August, back above the 50 line that separates improvement from decline. Think of it as a monthly mood check on Kenyan firms. The caveat: output still contracted for a seventh month, so this is a demand-led improvement, not yet a broad recovery.
- Rising inflation: Annual inflation rose to 6.8% from 6.6%, the highest since January 2024 and the sixth month above the 5% midpoint of CBK’s 2.5% to 7.5% target band. Food (9.5%) and transport (15.6%) led, and core inflation climbed to 4.0% from 3.4%. Inflation is the quiet tax on savings: a fund earning less than 6.8% is losing purchasing power.
- NSE volatility: Market capitalisation hit a record KSh4.29 trillion on 3rd September, then fell 4.96% in the week to 17th September after the High Court nullified the KSh204.3 billion sale of a 15% Safaricom stake to Vodacom (appeals are planned). The month closed 2.28% lower at KSh4.12 trillion. Volatility is the entry fee for equities, and why many portfolios keep a steady core in money market and fixed income funds.
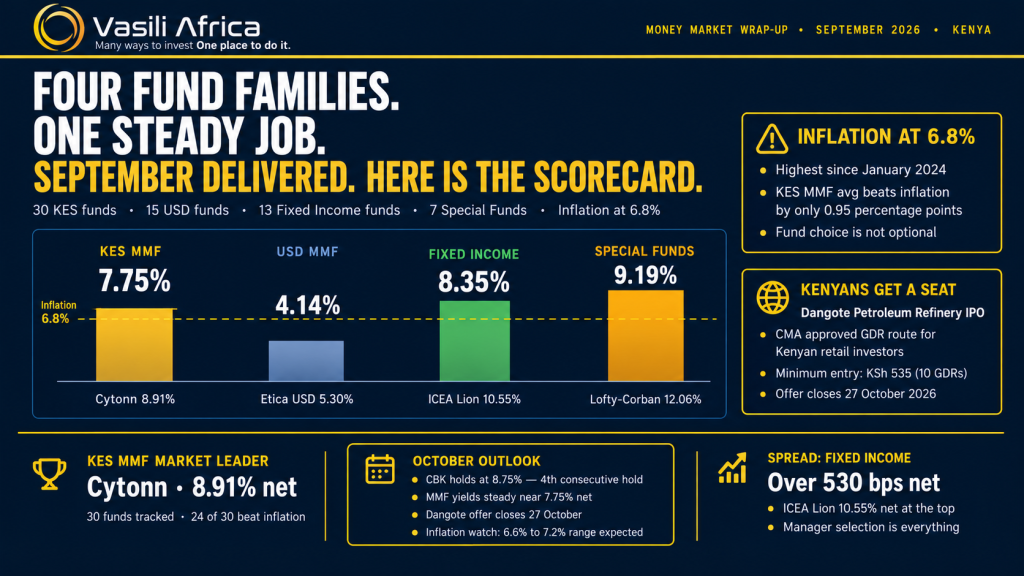
| 7.75% KES money market funds, average net | 8.35% Fixed income funds, average net | 9.19% Special funds, average net | 4.14% USD money market funds, average net | 6.8% Annual inflation, September |
Averages are daily cumulative averages, net of tax. Inflation: KNBS, 30th September 2026.
| How to read the numbersAverage yield is the headline rate a fund earned over the month, before tax. Net return is what lands in your pocket after 15% withholding tax on the interest. Fund managers advertise the first number; your bank balance reflects the second. Past performance is a useful guide, not a promise. |
The Scorecard: Four Fund Families, One Picture
Special funds led on yield, fixed income funds followed and shilling money market funds came third. Dollar funds sit lower because dollar interest rates are lower than shilling ones. That is not a weakness; it is a different job and a different currency.
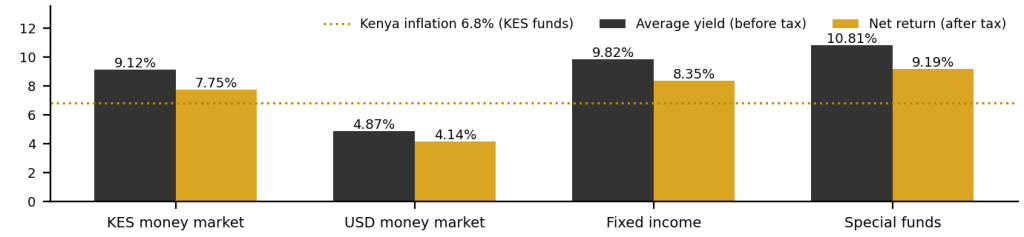
Figure 1: Average yield versus net return after tax, by fund category, September 2026. The inflation line is relevant to shilling funds only.
The practical takeaway: after tax, the average shilling money market fund beat inflation by only 0.95 percentage points (7.75% against 6.8%). That is a thin cushion, and it is why picking the right fund inside a category matters as much as picking the category.
Kenya Shilling Money Market Funds
Cytonn Money Market Fund took the top spot with an average yield of 10.49%, or 8.91% after tax, with Faulu (8.89%) a whisker behind. Lofty-Corban (8.64%) and Enwealth (8.62%) completed the leading four, and Jubilee and Madison tied at 8.50%. The category’s daily cumulative average was 9.12% before tax and 7.75% after, only about 0.35 points above the 91-day Treasury bill (8.77%), a reminder of how closely money market yields track government paper. Nineteen of the 30 funds finished at or above the average, and 24 of 30 beat inflation. The six that did not were African Alliance Kenya (6.66%), Mayfair (6.65%), Co-op (6.49%), ICEA Lion (6.36%), Absa Shilling Fund (6.27%) and Equity (4.56%). Fund choice, not just category, drives your outcome.
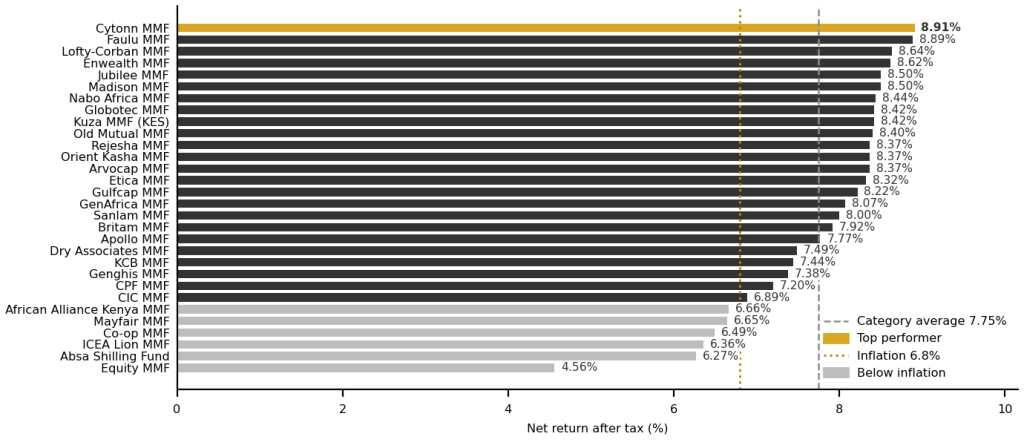
Figure 2: KES money market fund net returns after tax, September 2026. Yellow marks the top performer; grey bars fell short of 6.8% inflation.
| # | Fund Manager | Fund Name | Average Yield (%) | Net Return After Tax (%) |
|---|---|---|---|---|
| 1 | Cytonn Asset Managers Limited | Cytonn Money Market Fund | 10.49 | 8.91 |
| 2 | Faulu Microfinance Bank | Faulu Money Market Fund | 10.46 | 8.89 |
| 3 | Lofty-Corban Investments Limited | Lofty-Corban Money Market Fund | 10.16 | 8.64 |
| 4 | Enwealth Financial Services | Enwealth Money Market Fund | 10.14 | 8.62 |
| 5 | Jubilee Financial Services Limited | Jubilee Money Market Fund | 10.00 | 8.50 |
| 6 | Madison Investment Managers Limited | Madison Money Market Fund | 10.00 | 8.50 |
| 7 | Nabo Capital Limited | Nabo Africa Money Market Fund | 9.93 | 8.44 |
| 8 | Globotec Asset Managers Ltd | Globotec Money Market Fund | 9.91 | 8.42 |
| 9 | Kuza Asset Management Limited | Kuza Money Market Fund (KES) | 9.90 | 8.42 |
| 10 | Old Mutual Investment Group | Old Mutual Money Market Fund | 9.88 | 8.40 |
| 11 | Capital A Investment Bank | Rejesha Money Market Fund | 9.85 | 8.37 |
| 12 | Orient Asset Managers | Orient Kasha Money Market Fund | 9.85 | 8.37 |
| 13 | Arvocap Asset Managers Ltd | Arvocap Money Market Fund | 9.85 | 8.37 |
| 14 | Etica Capital Limited | Etica Money Market Fund | 9.79 | 8.32 |
| 15 | Gulfcap Investment Bank | Gulfcap Money Market Fund | 9.67 | 8.22 |
| 16 | GenAfrica Asset Managers Limited | GenAfrica Money Market Fund | 9.49 | 8.07 |
| 17 | Sanlam Investments East Africa Limited | Sanlam Money Market Fund | 9.41 | 8.00 |
| 18 | Britam Asset Managers (Kenya) Limited | Britam Money Market Fund | 9.31 | 7.92 |
| 19 | Apollo Asset Management Company Limited | Apollo Money Market Fund | 9.14 | 7.77 |
| 20 | Dry Associates | Dry Associates Money Market Fund | 8.81 | 7.49 |
| 21 | KCB Group | KCB Money Market Fund | 8.75 | 7.44 |
| 22 | Genghis Capital | Genghis Money Market Fund | 8.68 | 7.38 |
| 23 | CPF Asset Managers | CPF Money Market Fund | 8.47 | 7.20 |
| 24 | CIC Asset Managers Limited | CIC Money Market Fund | 8.10 | 6.89 |
| 25 | African Alliance KE Asset Managers | African Alliance Kenya Money Market Fund | 7.84 | 6.66 |
| 26 | Mayfair Asset Managers | Mayfair Money Market Fund | 7.83 | 6.65 |
| 27 | Co-op Trust Investment Services Limited | Co-op Money Market Fund | 7.64 | 6.49 |
| 28 | ICEA Lion Asset Management Limited | ICEA Lion Money Market Fund | 7.48 | 6.36 |
| 29 | Absa Bank | Absa Shilling Fund MMF | 7.38 | 6.27 |
| 30 | Equity Bank | Equity Money Market Fund | 5.37 | 4.56 |
| Daily Cumulative Average | 9.12 | 7.75 |
US Dollar Money Market Funds
Etica MMF USD led with 6.24% before tax (5.30% net), followed by Nabo Africa at 6.03% (5.13% net) and Cytonn at 5.28% (4.49% net). The category averaged 4.87% gross and 4.14% net. Nine of the 15 funds finished at or above the average, and the gap from the leader to NCBA at the bottom (2.83% net) was a wide 2.47 points. The shilling was steady at about KSh129.5 to 129.8 per dollar through September (CBK), so dollar funds worked as a quiet diversifier this month rather than a currency bet.
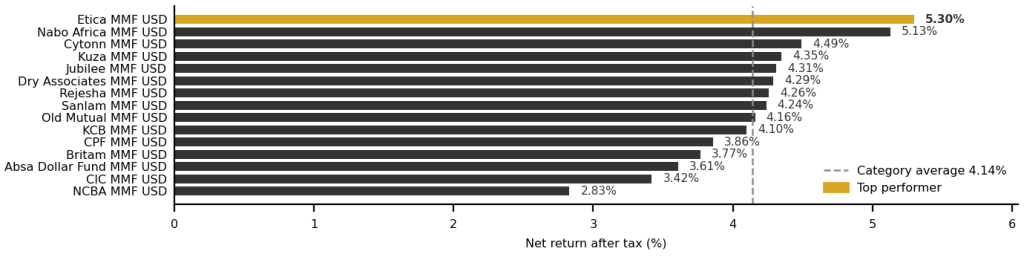
Figure 3: USD money market fund net returns after tax, September 2026.
| # | Fund Manager | Fund Name | Average Yield (%) | Net Return After Tax (%) |
|---|---|---|---|---|
| 1 | Etica Capital Limited | Etica MMF USD | 6.24 | 5.30 |
| 2 | Nabo Capital Limited | Nabo Africa Money Market Fund USD | 6.03 | 5.13 |
| 3 | Cytonn Asset Managers Limited | Cytonn Money Market Fund USD | 5.28 | 4.49 |
| 4 | Kuza Asset Management Limited | Kuza Money Market Fund USD | 5.12 | 4.35 |
| 5 | Jubilee Asset Management Limited | Jubilee MMF USD | 5.07 | 4.31 |
| 6 | Dry Associates Investment Bank | Dry Associates Money Market Fund USD | 5.05 | 4.29 |
| 7 | Capital A Investment Bank | Rejesha Money Market Fund USD | 5.01 | 4.26 |
| 8 | Sanlam Investments East Africa Limited | Sanlam Money Market Fund USD | 4.99 | 4.24 |
| 9 | Old Mutual Investment Group | Old Mutual Money Market Fund USD | 4.90 | 4.16 |
| 10 | KCB Group | KCB Money Market Fund USD | 4.82 | 4.10 |
| 11 | CPF Asset Managers | CPF Money Market Fund USD | 4.54 | 3.86 |
| 12 | Britam Asset Managers (Kenya) Limited | Britam Money Market Fund USD | 4.43 | 3.77 |
| 13 | Absa Bank | Absa Dollar Fund MMF USD | 4.25 | 3.61 |
| 14 | CIC Asset Managers Limited | CIC Money Market Fund USD | 4.02 | 3.42 |
| 15 | NCBA Investment Bank Limited | NCBA Money Market Fund USD | 3.33 | 2.83 |
| Daily Cumulative Average | 4.87 | 4.14 |
Fixed Income Funds
Fixed income funds invest mainly in government and corporate bonds. They usually pay more than money market funds, but returns can move around more because bond prices change daily. ICEA Lion Fixed Income Fund led at 12.41% before tax (10.55% net), ahead of Zimele (10.07% net) and African Alliance Kenya (9.85% net). The category averaged 9.82% gross and 8.35% net. Six of the 13 funds out-earned the best shilling money market fund (8.91% net), helped by long-dated government paper: the 20-year bond re-opened on 30th September at an average 13.60%, against 8.77% on the 91-day bill. The flip side is the range: the top fund earned more than double the bottom one, NCBA, at 5.17% net.
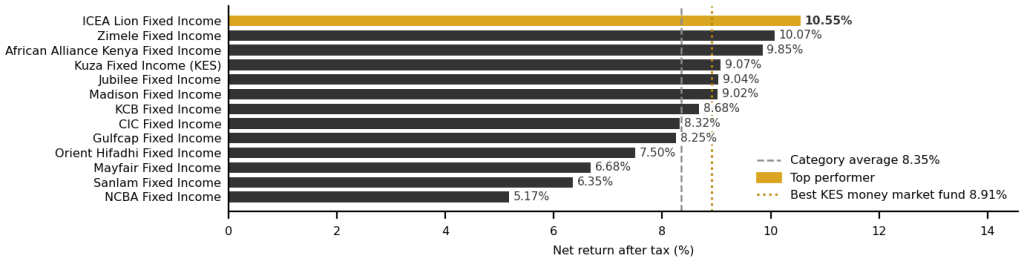
Figure 4: Fixed income fund net returns after tax, September 2026.
| # | Fund Manager | Fund Name | Average Yield (%) | Net Return After Tax (%) |
|---|---|---|---|---|
| 1 | ICEA Lion Asset Management Limited | ICEA Lion Fixed Income Fund | 12.41 | 10.55 |
| 2 | Zimele Asset Management | Zimele Fixed Income Fund | 11.84 | 10.07 |
| 3 | African Alliance KE Asset Managers | African Alliance Kenya Fixed Income Fund | 11.59 | 9.85 |
| 4 | Kuza Asset Management | Kuza Fixed Income Fund (KES) | 10.67 | 9.07 |
| 5 | Jubilee Asset Management Limited | Jubilee Fixed Income Fund | 10.64 | 9.04 |
| 6 | Madison Asset Managers | Madison Fixed Income Fund | 10.61 | 9.02 |
| 7 | KCB Group | KCB Fixed Income Fund | 10.21 | 8.68 |
| 8 | CIC Asset Managers Limited | CIC Fixed Income Fund | 9.79 | 8.32 |
| 9 | Gulfcap Investment Bank | Gulfcap Fixed Income Fund | 9.71 | 8.25 |
| 10 | Orient Asset Managers Limited | Orient Hifadhi Fixed Income Fund | 8.82 | 7.50 |
| 11 | Mayfair Asset Managers | Mayfair Fixed Income Fund | 7.86 | 6.68 |
| 12 | Sanlam Investments East Africa Limited | Sanlam Fixed Income Fund | 7.47 | 6.35 |
| 13 | NCBA Investment Bank Limited | NCBA Fixed Income Fund | 6.08 | 5.17 |
| Daily Cumulative Average | 9.82 | 8.35 |
Special Funds
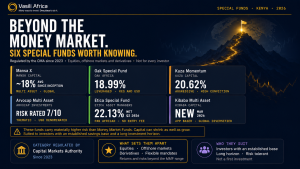
Special funds are the specialists: private debt, high-yield strategies and fixed-term products. They tend to pay more, and they ask for something in return, such as longer lock-in periods or more risk. Lofty-Corban Private Debt Fund topped not just this category but the entire report, at 14.19% before tax and 12.06% net. Dry Associates Special High Yield Fund followed at 10.02% net, then Madison Wealth Fund at 9.51%. The category averaged 10.81% gross and 9.19% net. In the Britam Special Fixed Income range, the longer you commit, the more you earn: the 3-month, 6-month and 1-year versions returned 7.96%, 7.98% and 8.13% net. The reward for patience is real, but small.

Figure 5: Special fund net returns after tax, September 2026.
| # | Fund Manager | Fund Name | Average Yield (%) | Net Return After Tax (%) |
|---|---|---|---|---|
| 1 | Lofty-Corban Asset Management | Lofty-Corban Private Debt Fund | 14.19 | 12.06 |
| 2 | Dry Associates Investment Bank | Dry Associates Special High Yield Fund | 11.78 | 10.02 |
| 3 | Madison Asset Managers | Madison Wealth Fund | 11.19 | 9.51 |
| 4 | CIC Asset Managers Limited | CIC Global Balanced Fund | 10.21 | 8.68 |
| 5 | Britam Asset Managers (Kenya) Limited | Britam Special Fixed Income Fund (1 year) | 9.56 | 8.13 |
| 6 | Britam Asset Managers (Kenya) Limited | Britam Special Fixed Income Fund (6 months) | 9.38 | 7.98 |
| 7 | Britam Asset Managers (Kenya) Limited | Britam Special Fixed Income Fund (3 months) | 9.36 | 7.96 |
| Daily Cumulative Average | 10.81 | 9.19 |
In the News: Kenyans Get a Seat at the Dangote Refinery IPO
On 5th October, the Capital Markets Authority (CMA) approved a Short Form Prospectus from Renaissance Capital (Kenya) Limited, opening a route for eligible Kenyan investors into the Dangote Petroleum Refinery & Petrochemicals IPO in Nigeria through Global Depositary Receipts (GDRs). The Lagos offer of 4.1 billion shares at ₦525 (about ₦2.15 trillion, or US$1.6 billion) opened on 14th September and is scheduled to close on 27th October 2026 following an approved two-week extension. Following strong feedback, Renaissance Capital also lowered the minimum entry barrier for Kenyan retail investors from 2,000 GDRs (KSh 107,000) to just 10 GDRs (KSh 535) at KSh 53.50 per receipt.
| What is a GDR?A GDR is a certificate that represents shares in a foreign company. You hold it locally, in shillings, and it gives you the economic exposure of a shareholder without buying Nigerian shares directly. That includes dividends and naira currency risk. The GDRs are only structured after the IPO closes and shares are allocated; the target NSE listing date is 8 December, subject to approval from Nigeria’s SEC. |
More detail: Dangote IPO GDR route explained. The fine print: CMA has stressed that approving the prospectus is not an investment recommendation, and that the offer covers the Nigerian refinery only, not the proposed Lamu project. Read the offer documents and speak to an independent adviser before taking part.
What to Expect in October 2026
VIEWS BELOW ARE DIRECTIONAL, NOT GUARANTEED
- Money market yields: steady. CBK held the Central Bank Rate at 8.75% on 7th October 2026, its fourth consecutive hold since the February cut, and the next meeting is in December. Treasury bill rates have barely moved (91-day at 8.77%, 364-day at 9.04%), so we expect October net yields to hover near September’s 7.75% average, with at most a marginal drift lower.
- Inflation: watch the upper edge of the band. At 6.8%, headline inflation sits 0.7 points under the 7.5% ceiling. With energy costs elevated and food prices firm, we see the October reading in a 6.6% to 7.2% range, with risks tilted up. A reading at the top end would squeeze real returns on money market funds.
- The Dangote IPO: decision time. The offer closes on 13th October 2026, followed by allocation and Nigerian SEC approval, so GDR trading on the NSE is unlikely before the 8 December target. Treat early listing talk with caution until approvals are confirmed.
- The NSE: choppy, with the Safaricom appeal and results season as catalysts. Investors who prefer a steadier ride have their answer in the funds above.
- Fixed income and special funds: manager choice matters most. Spreads were wide in September: over five points between best and worst in fixed income, and over four in shilling money market funds. Gaps like these tend to persist, so October is a good month to compare your fund against its peers.
The October watch list
| When | What | Why it matters |
|---|---|---|
| Every Thursday | Treasury bill auctions | Set the tone for money market yields. |
| 27th October | Dangote IPO closes | Starts the allocation and GDR process. |
| Appeal timeline | Safaricom stake ruling | Government and Vodacom are appealing; outcome may move NSE sentiment. |
| End of October | October inflation figure (KNBS) | Shows whether 6.8% was a blip or a trend. |
| Late Oct to Nov | Corporate results season | Company earnings are likely to move share prices. |
| 8th December (target) | Dangote GDRs list on NSE; next CBK MPC in December | Sets direction for equities and for yields into year-end. |
Our House View: Maintain diversification across currencies and asset durations, watch fund-level fees closely because they have a larger cumulative impact than most expect, and treat any single month’s rankings as one data point rather than a conclusion.
This report is produced by Vasili Africa for informational purposes only and does not constitute investment advice. Past performance is not indicative of future results. Fund figures are net of an assumed withholding tax of 15% and sourced from fund manager disclosures for September 2026. Macro data: KNBS, CBK, Stanbic Bank Kenya PMI (S&P Global), Nairobi Securities Exchange and CMA.