THE MONTH IN BRIEF
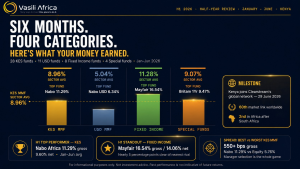
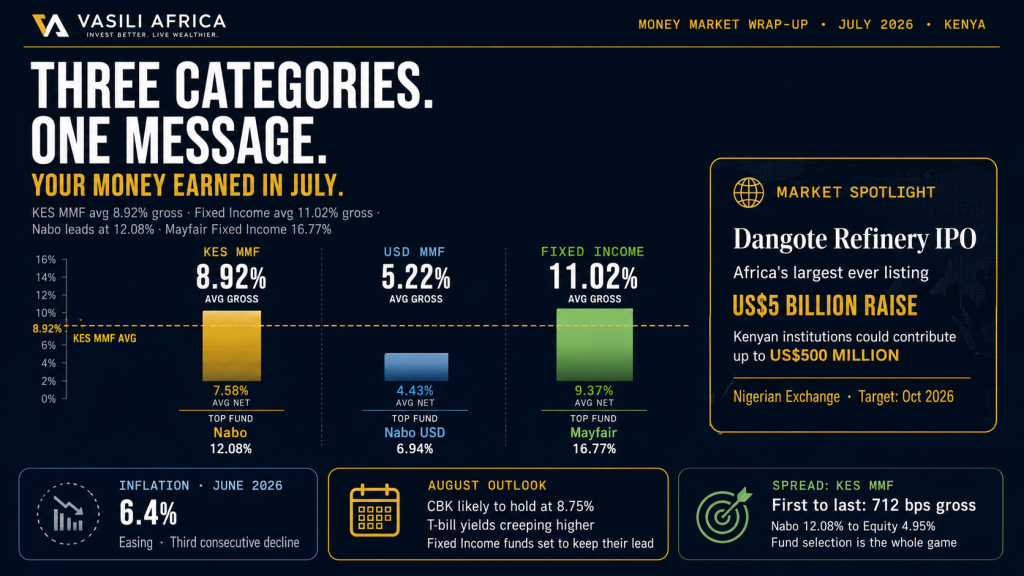
If you left your money to work in July while you were busy with everything else, good news it clocked in, put in the hours, and came home with a decent payslip. Across the board, Kenya’s money market funds kept doing what they do best: quietly outrunning your bank’s savings account without asking for a standing ovation. The industry-wide shilling MMF average landed at 8.92% gross, 7.58% net of the 15% withholding tax a shade off June, but still comfortably ahead of inflation, which eased to 6.4% over the same stretch.
The order at the top barely moved. Nabo Africa Money Market Fund held its lead at a net 10.26%, trailed by Cytonn (9.32%) and Lofty-Corban (8.56%) Meanwhile the Dollar funds had their own quieter conversation, averaging a net 4.43%, and the Fixed Income funds, the patient cousins of this family pulled in a net 9.37% on average, led by a standout Mayfair print of 14.25%.
Three fund categories carried one message: cash sitting idle in a current account in July 2026 was cash leaving money on the table.
SHILLING MONEY MARKET FUNDS
The Home Crowd: KES Money Market Funds
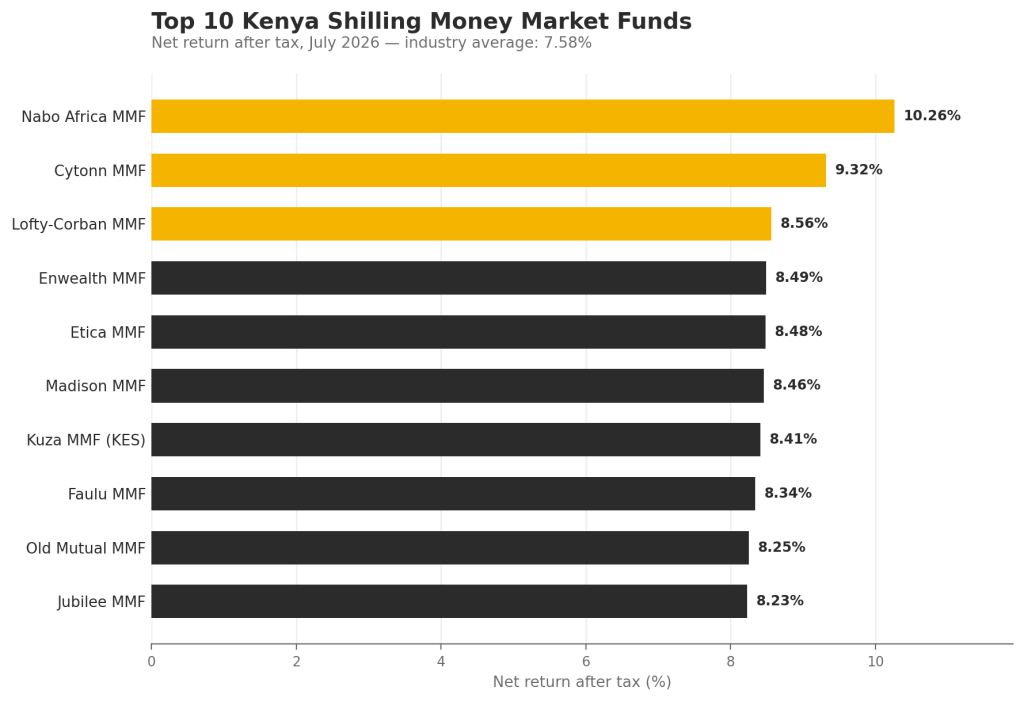
Twenty-eight funds, one currency, and a fairly wide spread between first and last which is exactly why this table is worth reading past the top three. Nabo Africa keeps its crown with a net 10.26%, more than double what Equity Money Market Fund closed the month with (4.21%). The middle of the pack Etica, Madison, Kuza, Faulu is where most of the industry actually lives, clustered tightly around 8.3% — 8.5%, close enough that fees and minimums matter as much as headline yield.
| # | Fund Manager | Fund | Avg. Return | Net Return |
|---|---|---|---|---|
| 1 | Nabo Capital Limited | Nabo Africa Money Market Fund | 12.08% | 10.26% |
| 2 | Cytonn Asset Managers Limited | Cytonn Money Market Fund | 10.96% | 9.32% |
| 3 | Lofty-Corban | Lofty-Corban Money Market Fund | 10.07% | 8.56% |
| 4 | Enwealth Financial Services | Enwealth Money Market Fund | 9.99% | 8.49% |
| 5 | Etica Capital Limited | Etica Money Market Fund | 9.97% | 8.48% |
| 6 | Madison Investment Managers Limited | Madison Money Market Fund | 9.95% | 8.46% |
| 7 | Kuza Asset Management Limited | Kuza Money Market Fund (KES) | 9.90% | 8.41% |
| 8 | Faulu Microfinance Bank | Faulu Money Market Fund | 9.81% | 8.34% |
| 9 | Old Mutual Investment Group | Old Mutual Money Market Fund | 9.70% | 8.25% |
| 10 | Jubilee Financial Services Limited | Jubilee Money Market Fund | 9.68% | 8.23% |
| 11 | Gulfcap | Gulfcap Money Market Fund | 9.66% | 8.22% |
| 12 | Arvocap | Arvocap Money Market Fund | 9.63% | 8.19% |
| 13 | Orient Asset Managers | Orient Kasha Money Market Fund | 9.57% | 8.13% |
| 14 | Britam Asset Managers (Kenya) Limited | Britam Money Market Fund | 9.54% | 8.11% |
| 15 | GenAfrica Asset Managers Limited | GenAfrica Money Market Fund | 9.17% | 7.80% |
| 16 | KCB Group | KCB Money Market Fund | 8.90% | 7.57% |
| 17 | Apollo Asset Management Company Limited | Apollo Money Market Fund | 8.85% | 7.53% |
| 18 | Sanlam Investments East Africa Limited | Sanlam Money Market Fund | 8.76% | 7.45% |
| 19 | Dry Associates | Dry Associates Money Market Fund | 8.59% | 7.31% |
| 20 | Genghis Capital | Genghis Money Market Fund | 8.14% | 6.92% |
| 21 | CIC Asset Managers Limited | CIC Money Market Fund | 8.12% | 6.90% |
| 22 | CPF | CPF Money Market Fund | 7.93% | 6.74% |
| 23 | ICEA Lion Asset Management Limited | ICEA Lion Money Market Fund | 7.71% | 6.55% |
| 24 | Co-op Trust Investment Services Limited | Co-op Money Market Fund | 7.70% | 6.54% |
| 25 | Mayfair Asset Managers | Mayfair Money Market Fund | 7.60% | 6.46% |
| 26 | ABSA Bank | Absa Shilling Fund MMF | 6.98% | 5.93% |
| 27 | African Alliance | African Alliance Kenya Money Market Fund | 5.83% | 4.96% |
| 28 | Equity Bank | Equity Money Market Fund | 4.95% | 4.21% |
| Daily Cumulative Average | 8.92% | 7.58% |
DOLLAR MONEY MARKET FUNDS
The Hedge: US Dollar Money Market Funds
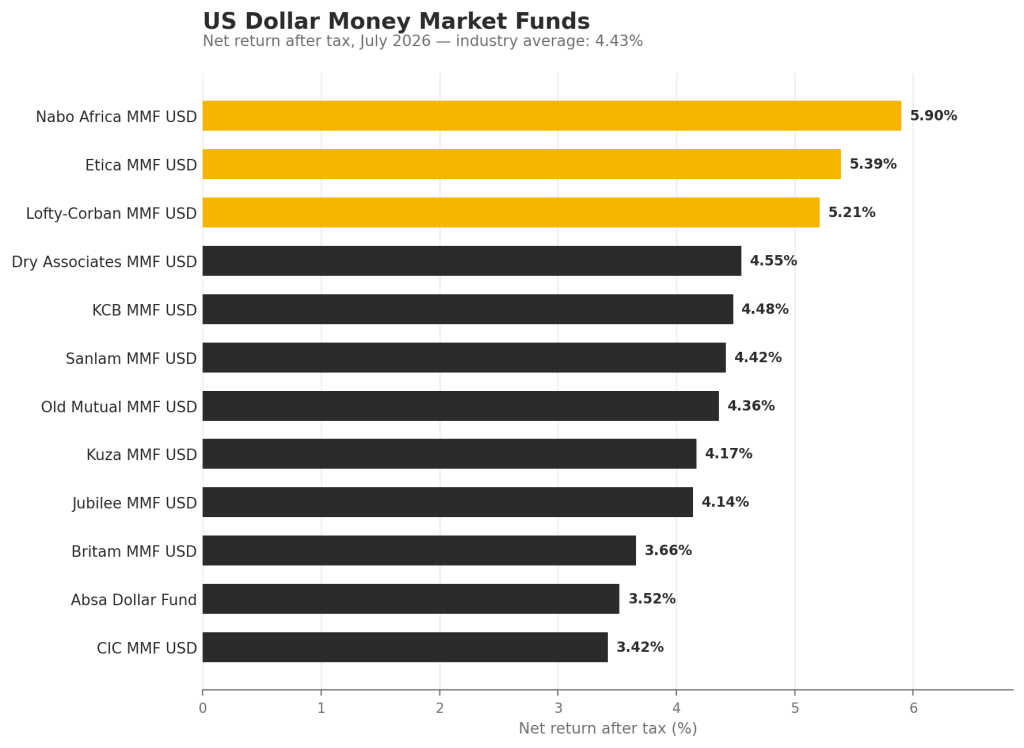
For investors keeping a foot in hard currency abroad, import bills, or simply a hedge against shilling wobble, the Dollar MMF table tells its own story. Nabo Africa again sits top of the pile with a net 5.90%, with Etica USD (5.39%) and Lofty-Corban USD (5.21%) rounding out a podium that mirrors the shilling side almost exactly. The category average came in at a net 4.43%, roughly half the shilling average the going rate, more or less, for the comfort of holding dollars in a market where the shilling has actually been the steadier party this year.
| # | Fund Manager | Fund | Avg. Return | Net Return |
|---|---|---|---|---|
| 1 | Nabo Capital Limited | Nabo Africa Money Market Fund USD | 6.94% | 5.90% |
| 2 | Etica Capital Limited | Etica MMF USD | 6.34% | 5.39% |
| 3 | Lofty-Corban | Lofty-Corban Money Market Fund USD | 6.13% | 5.21% |
| 4 | Dry Associates | Dry Associates Money Market Fund USD | 5.35% | 4.55% |
| 5 | KCB Group | KCB Money Market Fund USD | 5.27% | 4.48% |
| 6 | Sanlam Investments East Africa Limited | Sanlam Money Market Fund USD | 5.19% | 4.42% |
| 7 | Old Mutual Investment Group | Old Mutual Money Market Fund USD | 5.13% | 4.36% |
| 8 | Kuza Asset Management Limited | Kuza Money Market Fund USD | 4.91% | 4.17% |
| 9 | Jubilee | Jubilee MMF USD | 4.87% | 4.14% |
| 10 | Britam Asset Managers (Kenya) Limited | Britam Money Market Fund USD | 4.31% | 3.66% |
| 11 | ABSA Bank | Absa Dollar Fund MMF | 4.15% | 3.52% |
| 12 | CIC Asset Managers Limited | CIC Money Market Fund USD | 4.02% | 3.42% |
| Daily Cumulative Average | 5.22% | 4.43% |
FIXED INCOME FUNDS
The Long Game: Fixed Income Funds
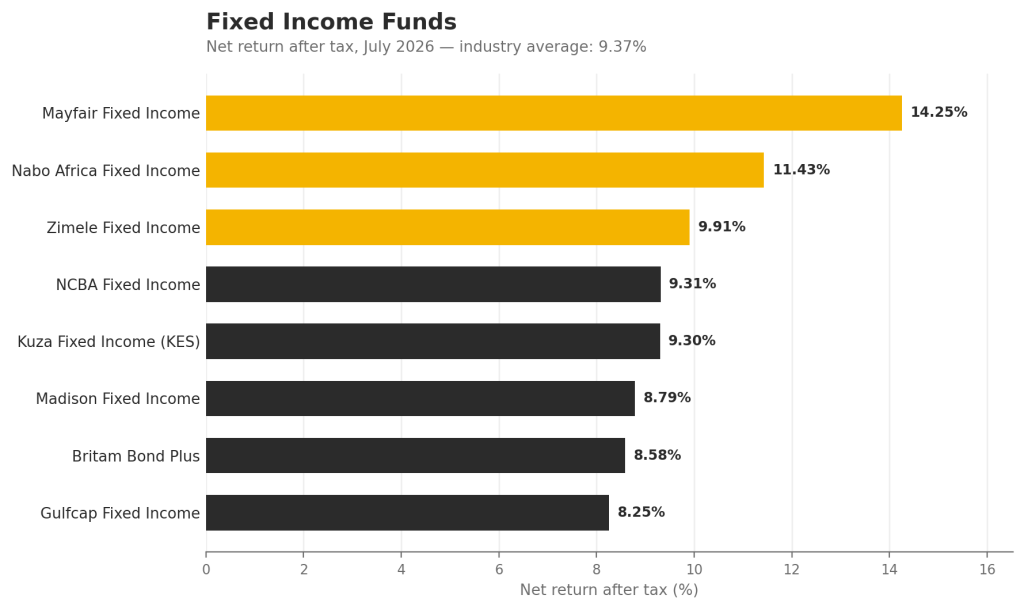
Eight funds, one job: reward the investor who can afford to wait a little longer for a bigger cheque. Mayfair Fixed Income Fund ran away with July, posting a net 14.25% nearly three points clear of second-placed Nabo Africa Fixed Income (11.43%). The category’s daily cumulative average of 9.37% net comfortably beat both money market categories, which is the entire point of a fixed income allocation: less liquidity, more patience, better pay.
| # | Fund Manager | Fund | Avg. Return | Net Return |
|---|---|---|---|---|
| 1 | Mayfair Asset Managers | Mayfair Fixed Income Fund | 16.77% | 14.25% |
| 2 | Nabo Asset Managers | Nabo Africa Fixed Income Fund | 13.45% | 11.43% |
| 3 | Zimele Asset Management | Zimele Fixed Income Fund | 11.66% | 9.91% |
| 4 | NCBA | NCBA Fixed Income Fund | 10.95% | 9.31% |
| 5 | Kuza Asset Management Limited | Kuza Fixed Income Fund (KES) | 10.94% | 9.30% |
| 6 | Madison Asset Managers | Madison Fixed Income Fund | 10.34% | 8.79% |
| 7 | Britam Asset Managers (Kenya) Limited | Britam Bond Plus Fund | 10.10% | 8.58% |
| 8 | Gulfcap | Gulfcap Fixed Income Fund | 9.71% | 8.25% |
| Daily Cumulative Average | 11.02% | 9.37% |
BIG PICTURE
Three Categories, Side by Side
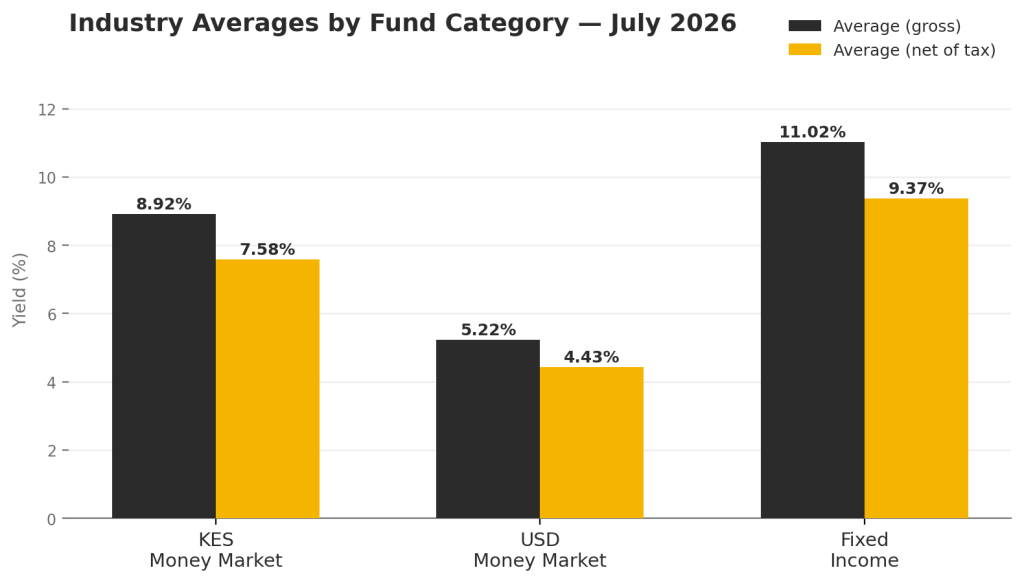
Line up and the logic of asset allocation writes itself: Fixed Income funds paid the most for the longest patience, Shilling MMFs paid solidly for staying liquid, and Dollar MMFs paid the least in yield but bought the most peace of mind against currency risk. None of these is the “right” answer on its own; the right mix is whichever blend matches how soon you’ll need the money back.
MARKET SPOTLIGHT
Kenyan Money Eyes Africa’s Biggest IPO
Dangote Refinery’s planned US$5 billion initial public offering is set to be Africa’s largest-ever listing is drawing serious interest from this side of the border. According to Reuters, Kenyan investors, pension funds included, could contribute up to US$500 million, about a tenth of the raise, though that figure describes fundraising share rather than confirmed ownership since Dangote has not yet disclosed how much equity it will sell.
- The primary listing goes to the Nigerian Exchange, where a US$5bn raise would equal roughly 4% of the bourse’s US$116bn market cap.
- A source described institutional appetite among Kenyan investors to Reuters as “tremendous.”
- Dangote has filed its initial application and could publish a prospectus in September, with listing targeted for October.
- Reuters reports no cross-listing on African exchanges is currently planned, Kenyan investors would likely access the offer through structured instruments such as global depositary receipts.
- Proceeds are earmarked to help expand the 650,000 barrel-per-day Lagos refinery toward Dangote’s stated goal of 1.4 million barrels daily.
A recent private placement valued Dangote’s refining business at roughly US$40 billion, a figure Reuters notes looks punchy next to listed peers like Turkey’s Tupras (US$12bn) and US-listed HF Sinclair (US$16bn) something Kenyan institutions weighing a ticket will want to keep in view.
LOOKING AHEAD
What August 2026 Could Bring
The Monetary Policy Committee has kept the Central Bank Rate at 8.75% through two straight meetings and reconvened on 11th August. With June inflation cooling to 6.4% but analysts split some now leaning toward a modest hike, the most probable outcome is another hold, with a small hawkish tilt if oil or food prices surprise to the upside.
T-bill yields have quietly been creeping up. The 91-day, 182-day and 364-day papers all edged higher through July, with the 91-day print near 8.8% by month-end and auctions still drawing strong oversubscription. If that drift continues, expect MMF gross yields to firm slightly in August rather than fall further.
The net-of-tax gap stays the real story. With T-bill interest exempt from withholding tax for individual investors, a sub-8% T-bill yield can already outpace many MMFs after their 15% tax bite, a comparison more retail investors are starting to make, and one likely to keep pulling ladder-minded savers toward direct government paper.
Fixed Income funds should keep their lead. Longer-duration books tend to hold gains from earlier in the cutting cycle even as short rates stabilize, so look for Mayfair, Nabo Africa, and Zimele to remain the category’s pace-setters into August.
The shilling’s calm is the one to watch. A steady currency has kept Dollar MMF appeal muted this year; any wobble around the Dangote IPO capital flows, global oil prices, or Eurobond yields which ticked up in early July could quickly revive the case for a dollar hedge.
Base case for August: a rate hold, a gentle upward drift in T-bill and MMF yields, and Fixed Income funds keeping their crown. The wildcard is capital flow around Dangote’s Nigerian listing and any knock-on effect on regional currency sentiment.
As always, past performance across every table in this report describes what already happened, not what’s guaranteed next. Use it to compare managers on a level field, not as a forecast.