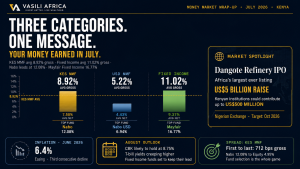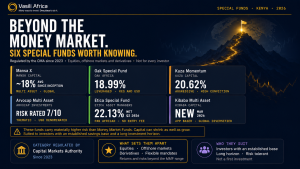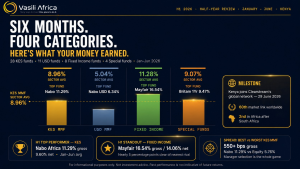
Kenya’s money market is sending a clear message at the midpoint of 2026: the era of easy double-digit yields has settled into a steadier, more selective phase, and the smart money knows exactly where to look. The Central Bank of Kenya has now held its policy rate at 8.75% for a fourth straight month, and June brought the first easing in inflation in three months, a small but welcome exhale. Meanwhile, several fund managers continue to deliver resilient, above-market performance, proving that in a plateauing rate environment, fund selection is doing more of the work than the market average.
Kenya Plugs Into the World’s Money Grid – The Clearstream Link Goes Live
On 29 June 2026, Kenya’s capital markets took a step forward: Clearstream, the Luxembourg-based international central securities depository, switched on a direct link to DhowCSD, Kenya’s central securities depository. Built on an omnibus account structure with Standard Chartered Kenya acting as local custodian and cash correspondent bank, the link allows Clearstream’s global client base to settle and safekeep Kenyan government bonds, infrastructure bonds and treasury bills without opening a local account or registering individually with the CBK.
Kenya becomes Clearstream’s 60th domestic market link globally, and only the second in Africa after South Africa. Clearstream is one of two dominant international securities depositories worldwide, alongside Euroclear, holding approximately €19 trillion in assets under custody for more than 2,500 clients across 110 countries. CBK Governor Dr. Kamau Thugge called it “a significant milestone in developing Kenya’s financial markets,” expected to deepen liquidity, broaden the investor base, and enhance resilience in Kenya’s domestic debt market. It will not move a single fund’s return this month but it is exactly the kind of quiet plumbing that tends to show up as deeper demand for government paper a few quarters down the line.
This is the June 2026 Money Market Wrap-Up. Just the data, the context, and what it means for your portfolio.
01. The Macro Backdrop: Rates Hold, Inflation Exhales
The CBK’s rate-cutting cycle, which took the policy rate from 9.0% in January to 8.75% in February, has now been on pause for four consecutive months. That single decision back in February remains the biggest reason MMF yields have drifted down from where they stood a year ago but with the rate steady since, the pace of that decline has itself been slowing.
Inflation, meanwhile, has been on an uneven walk: 4.4% in January, 4.3% in February, 4.4% in March, a jump to 5.6% in April, a further jump to 6.68% in May, and now a pullback to 6.4% in June the first month-on-month decline in three months. On a monthly basis, prices rose just 0.2%, with the Consumer Price Index moving from 154.56 to 154.91. Transport costs remain the biggest single driver, up 16.1% year-on-year, followed by Food and Non-Alcoholic Beverages (8.6%) and Housing, Water, Electricity, Gas and Other Fuels (3.4%) together more than 57% of the average household’s basket.
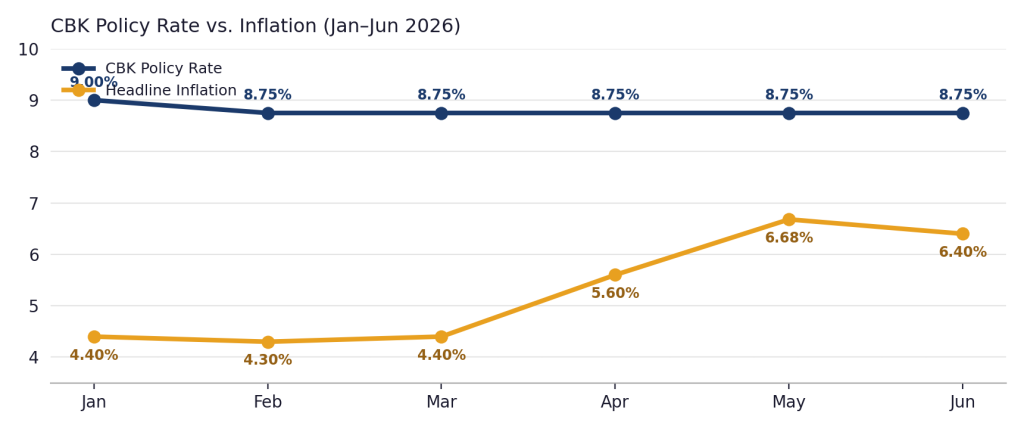
Figure 1: CBK Policy Rate vs. Inflation (Jan–Jun 2026)
The bottom line: Treasury bill yields remain on a gradual descent and most MMFs are expected to stay below the 10% gross mark through the second half of the year. But “most” is not “all” and that gap is exactly where opportunity hides.
02. Kenya Shilling MMFs: Who Is Holding the Line?
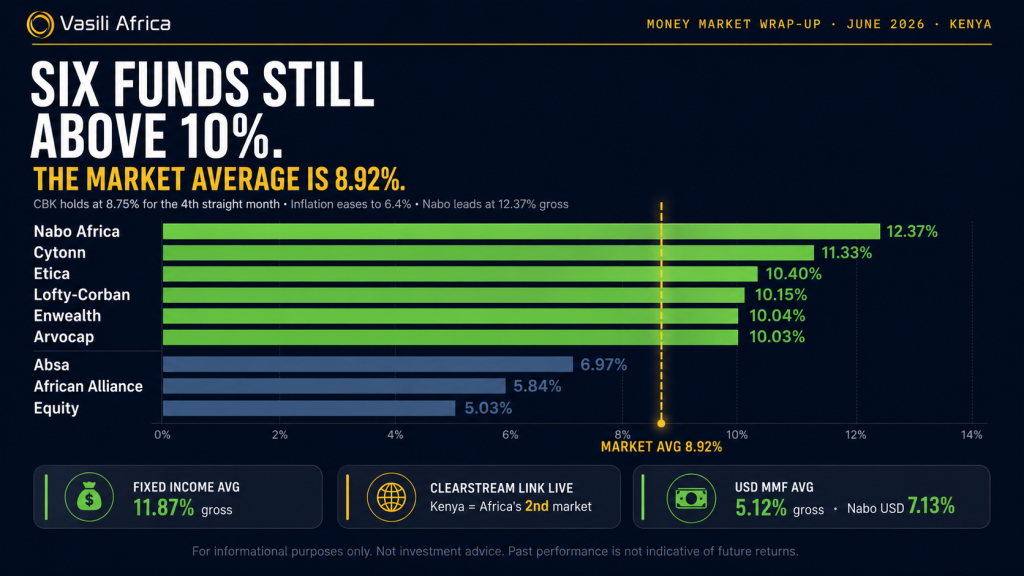
Across the 28 Kenya Shilling Money Market Funds tracked this month, the market average sits at 8.92% gross (7.58% after withholding tax) a touch below May’s 8.99%, but still comfortably ahead of a standard savings account and clear of the current inflation print. As ever, the real story is in the top tier.
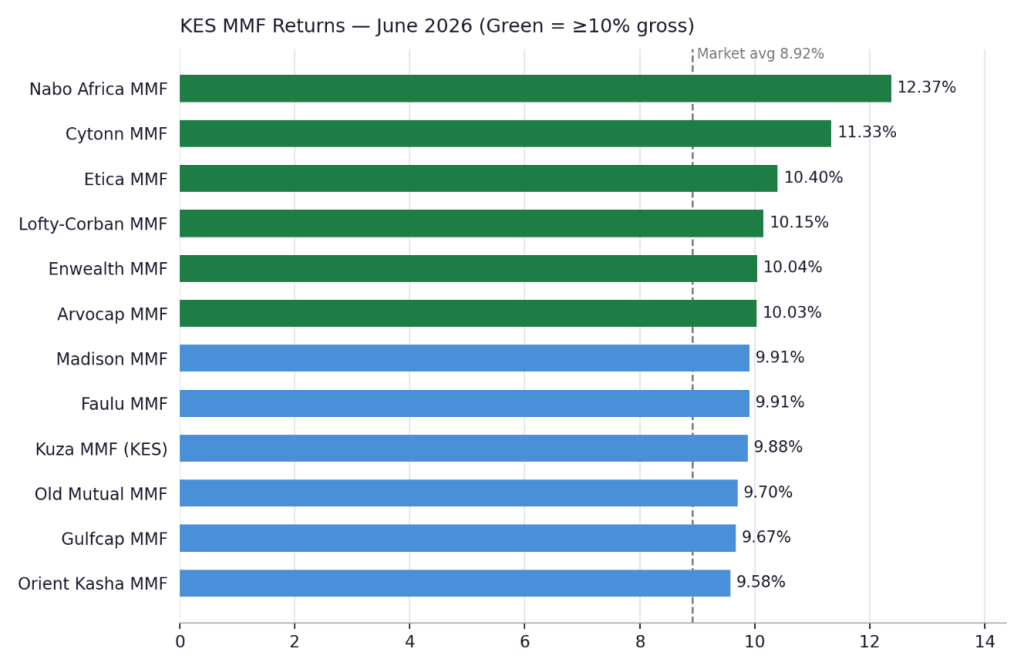
Figure 2: KES MMF Returns — June 2026 (Green bars = ≥10% gross)
Nabo Africa Money Market Fund leads the pack with a gross return of 12.37% p.a., netting investors 10.51% after tax — the strongest showing on the board for a second straight month. Cytonn Money Market Fund holds second at 11.33% gross / 9.63% net, followed by Etica (10.40% / 8.84%), Lofty-Corban (10.15% / 8.63%), Enwealth (10.04% / 8.53%) and Arvocap (10.03% / 8.52%) six funds clearing the 10% gross threshold this month, against a market average sitting nearly two full points below it.
| Fund Manager | Fund Name | Avg Return (%) | Net Return (%) |
|---|---|---|---|
| Nabo Capital Limited | Nabo Africa Money Market Fund | 12.37 | 10.51 |
| Cytonn Asset Managers Limited | Cytonn Money Market Fund | 11.33 | 9.63 |
| Etica Capital Limited | Etica Money Market Fund | 10.40 | 8.84 |
| Lofty-Corban | Lofty-Corban Money Market Fund | 10.15 | 8.63 |
| Enwealth Financial Services | Enwealth Money Market Fund | 10.04 | 8.53 |
| Arvocap | Arvocap Money Market Fund | 10.03 | 8.52 |
| Madison Investment Managers Limited | Madison Money Market Fund | 9.91 | 8.43 |
| Faulu Microfinance Bank | Faulu Money Market Fund | 9.91 | 8.42 |
| Kuza Asset Management Limited | Kuza Money Market Fund (KES) | 9.88 | 8.39 |
| Old Mutual Investment Group | Old Mutual Money Market Fund | 9.70 | 8.25 |
| Gulfcap | Gulfcap Money Market Fund | 9.67 | 8.22 |
| Orient Asset Managers | Orient Kasha Money Market Fund | 9.58 | 8.15 |
| Jubilee Financial Services Limited | Jubilee Money Market Fund | 9.33 | 7.93 |
| Britam Asset Managers (Kenya) Limited | Britam Money Market Fund | 9.25 | 7.86 |
| GenAfrica Asset Managers Limited | GenAfrica Money Market Fund | 9.04 | 7.68 |
| Apollo Asset Management Company Limited | Apollo Money Market Fund | 8.77 | 7.45 |
| Dry Associates | Dry Associates Money Market Fund | 8.74 | 7.43 |
| Sanlam Investments East Africa Limited | Sanlam Money Market Fund | 8.58 | 7.29 |
| KCB Group | KCB Money Market Fund | 8.55 | 7.27 |
| Genghis Capital | Genghis Money Market Fund | 8.53 | 7.25 |
| CIC Asset Managers Limited | CIC Money Market Fund | 8.12 | 6.90 |
| CPF | CPF Money Market Fund | 7.81 | 6.64 |
| Co-op Trust Investment Services Limited | Co-op Money Market Fund | 7.64 | 6.49 |
| ICEA Asset Lion Asset Management Limited | ICEA Lion Money Market Fund | 7.35 | 6.25 |
| Mayfair Asset Managers | Mayfair Money Market Fund | 7.32 | 6.22 |
| ABSA Bank | Absa Shilling Fund MMF | 6.97 | 5.92 |
| African Alliance | African Alliance Kenya Money Market Fund | 5.84 | 4.96 |
| Equity Bank | Equity Money Market Fund | 5.03 | 4.28 |
| Daily Cumulative Average | 8.92 | 7.58 |
Table 1: KES MMF Returns, June 2026 • Annualised % p.a. Past performance is not indicative of future returns. This report is for informational purposes only and does not constitute investment advice.
What This Means for Investors
- Liquidity remains a key strength of MMFs. You can exit at short notice without penalties, making them a superior alternative to fixed deposits for short-term funds.
- Stability in a volatile world: while equity markets gyrate, MMFs offer capital preservation with income, valuable when macroeconomic signals are mixed.
- Recalibrate your expectations: average returns are trending below 9% gross. If your benchmark was double digits a year ago, now is the time to reassess, or to consider the top-performing funds and fixed income alternatives.
03. Dollar MMFs: Earning in USD in East Africa
For those holding dollar-denominated savings, the value proposition remains compelling: earn in USD, sidestep KES depreciation risk, and still pocket meaningful returns. The sector average lands at 5.12% gross (4.35% net) comfortably ahead of a standard US bank savings account.
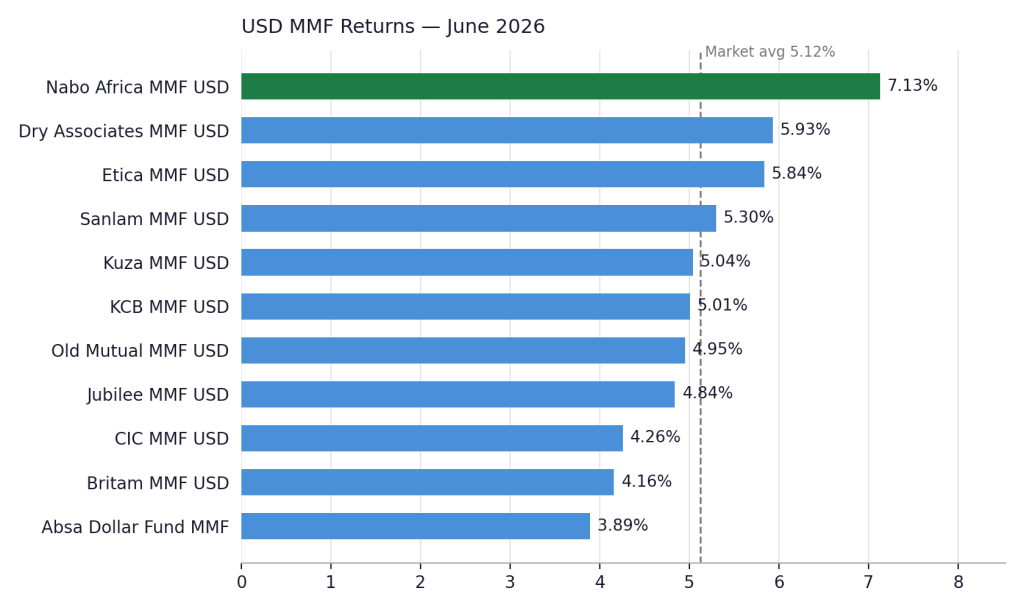
Figure 3: USD MMF Returns — June 2026
Nabo Africa Money Market Fund USD dominates the dollar segment again, posting 7.13% gross (6.06% net). Dry Associates MMF USD follows at 5.93% / 5.04%, while Etica MMF USD (5.84% / 4.97%) and Sanlam MMF USD (5.30% / 4.51%) round out a solid top four. At the lower end, Absa Dollar Fund MMF at 3.89% gross is a reminder that fund selection matters as much in the dollar segment as it does in Shilling funds.
| Fund Manager | Fund Name | Avg Return (%) | Net Return (%) |
|---|---|---|---|
| Nabo Capital Limited | Nabo Africa Money Market Fund USD | 7.13 | 6.06 |
| Dry Associates | Dry Associates Money Market Fund USD | 5.93 | 5.04 |
| Etica MMF | Etica MMF USD | 5.84 | 4.97 |
| Sanlam Investments East Africa Limited | Sanlam Money Market Fund USD | 5.30 | 4.51 |
| Kuza Asset Management Limited | Kuza Money Market Fund USD | 5.04 | 4.28 |
| KCB Group | KCB Money Market Fund USD | 5.01 | 4.26 |
| Old Mutual Investment Group | Old Mutual Money Market Fund USD | 4.95 | 4.21 |
| Jubilee | Jubilee MMF USD | 4.84 | 4.12 |
| CIC Asset Managers Limited | CIC Money Market Fund USD | 4.26 | 3.62 |
| Britam Asset Managers (Kenya) Limited | Britam Money Market Fund USD | 4.16 | 3.54 |
| ABSA Bank | Absa Dollar Fund MMF | 3.89 | 3.30 |
| Daily Cumulative Average | 5.12 | 4.35 |
Table 2: USD MMF Returns, June 2026 • Annualised % p.a. Past performance is not indicative of future returns. This report is for informational purposes only and does not constitute investment advice.
04. Fixed Income Funds: Where the Real Alpha Lives
If Money Market Funds are the steady handshake of the investment world, Fixed Income Funds are the firm grip. They carry marginally more risk and suit a slightly longer horizon, but the returns on offer in June 2026 make a compelling case for a closer look.
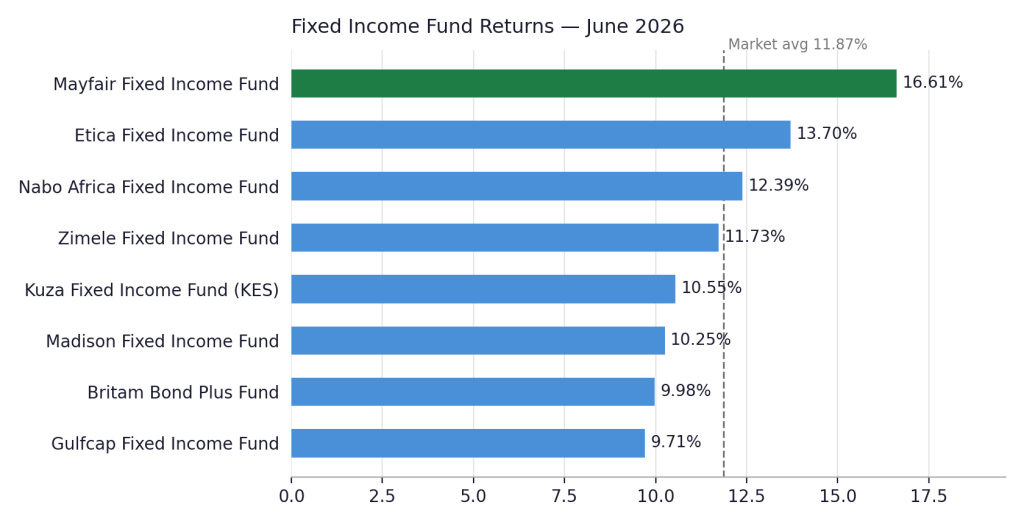
Figure 4: Fixed Income Fund Returns — June 2026
Mayfair Fixed Income Fund remains the standout story of the year so far, with a gross return of 16.61% (14.12% net) the result of consistent, deliberate duration management, and a category entirely its own. Behind Mayfair, Etica follows at 13.70% / 11.65%, Nabo Africa at 12.39% / 10.53%, and Zimele at 11.73% / 9.97%. Even Gulfcap at the foot of the table, posting 9.71% gross (8.25% net), sits comfortably above the MMF market average.
The sector average of 11.87% gross / 10.09% net is roughly 300 basis points above the MMF market average, a meaningful premium that compensates well for the marginally longer lock-in periods these funds typically carry.
| Fund Manager | Fund Name | Avg Return (%) | Net Return (%) |
|---|---|---|---|
| Mayfair Asset Managers | Mayfair Fixed Income Fund | 16.61 | 14.12 |
| Etica Capital | Etica Fixed Income Fund | 13.70 | 11.65 |
| Nabo Asset Managers | Nabo Africa Fixed Income Fund | 12.39 | 10.53 |
| Zimele Asset Management | Zimele Fixed Income Fund | 11.73 | 9.97 |
| Kuza Asset Management | Kuza Fixed Income Fund (KES) | 10.55 | 8.97 |
| Madison Asset Managers | Madison Fixed Income Fund | 10.25 | 8.72 |
| Britam Asset Managers (Kenya) Limited | Britam Bond Plus Fund | 9.98 | 8.49 |
| Gulfcap | Gulfcap Fixed Income Fund | 9.71 | 8.25 |
| Daily Cumulative Average | 11.87 | 10.09 |
Table 3: Fixed Income Fund Returns, June 2026 • Annualised % p.a. Past performance is not indicative of future returns. This report is for informational purposes only and does not constitute investment advice.
05. The Takeaway
The rate cycle has plateaued. That is not an alarm, it is context. Kenya’s MMF market remains one of the most accessible, liquid and transparent investment categories available to retail investors on the continent. Even at a market average of 8.92% gross, you are earning real returns comfortably above the CBK’s target midpoint, with daily liquidity.
But standing still is not a strategy. The funds at the top of these tables including Nabo Africa, Cytonn, Etica, Mayfair and Zimele are there because of active, deliberate portfolio decisions. If your current fund is sitting in the bottom quartile, it is worth asking why.
Use this report as a starting point. Do your due diligence. Ask your fund manager the hard questions. And if you are ready to explore where these instruments fit in your overall portfolio, take the next step today.
06. Looking Ahead: What July 2026 Could Bring
Forecasting is a dangerous business especially in a market shaped by central bank decisions, geopolitical tremors, and the unpredictable mood of global commodity prices. But informed speculation, grounded in the data we actually have, is not just useful. It is necessary. Here is our read of where July 2026 is headed, and what it means for your money.
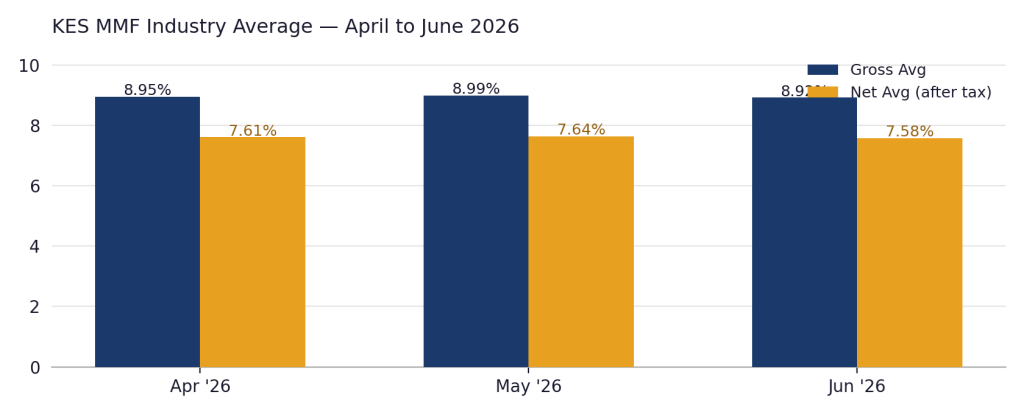
Figure 5: KES MMF Industry Average — April to June 2026
The CBK Pause Continues And That Is Still Good News
The CBK’s rate-cutting cycle, which took the policy rate down from 9.0% to 8.75% in February, has now held for four straight months. The Monetary Policy Committee has been consistent in framing current inflation as an imported-cost issue which is driven by fuel, transport and supply-chain pressures rather than excess domestic demand, which gives it room to hold rather than cut or hike.
The pause matters for MMF investors for a straightforward reason: when the policy rate holds steady, yields stop falling as fast. Do not expect a rebound to 11% or 12% territory across the board. But the floor increasingly looks like it is closer than it was six months ago. Expect most KES MMF gross returns to consolidate in the 8.3%–9.2% band through July, with the top performers those with flexibility to access commercial paper and higher-yield placements likely to hold above 10%.
Inflation: A Cautiously Encouraging Signal, With a Real Risk Attached
June’s pullback to 6.4%, from May’s 6.68% jump, is the first real evidence that the May spike may have been more seasonal than structural. If food and fuel costs continue to soften, July could bring a third straight month of easing a print somewhere in the high-5s to low-6s would not be a surprise if the current trend holds.
The risk that cannot be ignored: transport costs, at 16.1% year-on-year, remain the single largest driver of the CPI basket. It would only take a fresh fuel price shock or a logistics disruption to reverse two months of progress. At the current market average net return of 7.58% against 6.4% inflation, real returns for the typical KES MMF investor are hovering just above one percentage point positive, but thin. Funds in the bottom half of the performance table are delivering real returns close to zero or negative.
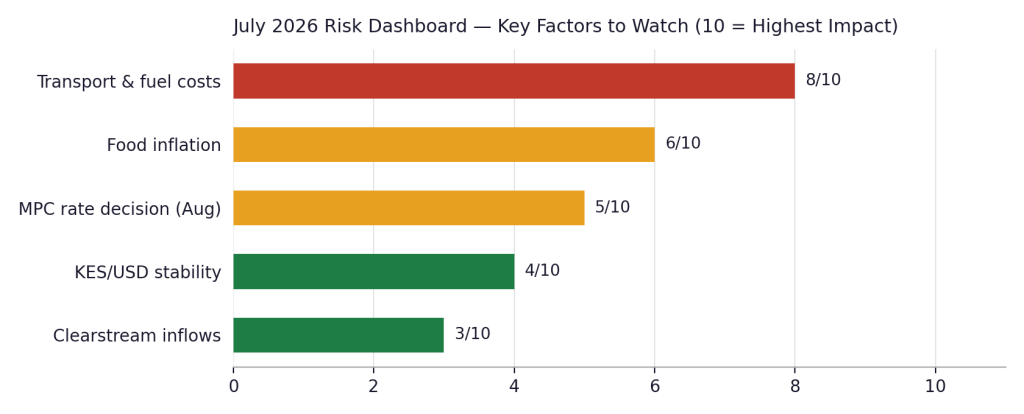
Figure 6: July 2026 Risk Dashboard — Key Factors to Watch (10 = Highest Impact)
Fixed Income: The July Opportunity
If there is one call to make heading into July, it is this: the case for Fixed Income Funds continues to strengthen. As MMF yields consolidate and the CBK holds, the spread between the two categories already roughly 300 basis points, is likely to hold or even widen slightly. Mayfair’s 16.61% gross return was not an accident; it reflects active duration management on longer-dated government paper, a positioning that could be further rewarded if the new Clearstream-DhowCSD link begins drawing in foreign demand for Kenyan bonds over the coming quarters.
Investors who have been sitting in MMFs and watching fixed income from the sidelines may find July a practical entry point. The sector average of 11.87% gross (10.09% net) is delivering close to 250 basis points of additional net return above the MMF average which is a premium that is unlikely to erode quickly given the CBK’s current holding pattern.
Three Scenarios for July 2026
| Scenario | Conditions | MMF Outlook |
|---|---|---|
| Base Case(Most Likely) | CBK holds at 8.75% through August. Inflation stabilises around 6.0%–6.5%. Transport and food costs ease gradually. | KES MMF average holds 8.5%–9.0% gross. Top funds stay above 10%. Fixed income continues to outperform. Real returns remain thin but positive for top-tier funds. |
| Bull Case | Inflation retreats sharply below 5.5% as fuel and food prices ease faster than expected. Clearstream link begins drawing visible foreign demand for Kenyan bonds. | MMF top tier reclaims 11%+ gross. Fixed income sector average nudges toward 12.5%+. Real returns turn more comfortably positive across the board. Strong month for yield seekers. |
| Bear Case | Transport and fuel costs reaccelerate, pushing inflation back above 7%. Global oil prices spike or the Shilling weakens against the dollar. | KES MMF average dips toward 8.0% gross. Real returns turn negative for lower-tier funds. USD funds become the clearer relative safe haven. |
Table 4: July 2026 Scenario Analysis • Speculative. Based on current macro trajectory and historical patterns.
The Bottom Line for July
- Yields are likely to stabilise, not collapse. Four months of a steady policy rate removes the biggest downward pressure that defined the past two years. July is unlikely to see further compression unless a surprise rate move materialises.
- June’s inflation pullback to 6.4% is the number to watch. A third consecutive decline in July would meaningfully ease the squeeze on real returns; a reversal, driven by transport or fuel costs, would tighten it again quickly.
- Fixed income is the July play for yield-seekers. With real MMF returns thin against 6.4% inflation, the incremental return from Fixed Income funds roughly 250 bps net above the MMF average which remains the clearest opportunity on the board for investors willing to extend their horizon slightly.
- The Clearstream-DhowCSD link is a multi-quarter story, not a July catalyst. Watch for early signals any pickup in foreign holdings of Kenyan government paper, or commentary from Standard Chartered on settlement volumes as the first real evidence the link is doing what it was built to do.
- Fund selection has never mattered more. With the spread between the best and worst-performing KES MMF exceeding 700 basis points gross, which fund you are in remains the difference between a comfortable real return and a wafer-thin one.
Data sourced from daily fund performance disclosures as published in Kenyan daily newspapers. Macro data sourced from the Central Bank of Kenya and the Kenya National Bureau of Statistics. Tracking methodology: daily effective annualised returns.
Forward-looking statements are speculative and based on current macro trajectory. Past performance is not a guide to future returns. Consult a Vasili Africa advisor before making any investment decision.