
August delivered exactly the kind of month that rewards investors who pay close attention to the fine print. While mainstream attention across Kenya remained fixed on the Nairobi Securities Exchange and the ongoing wave of corporate earnings, the quieter, steadier world of money market and fixed income funds continued doing what it does best: turning financial discipline into strong double-digit returns. Below, we break down who led the market, who lagged behind, and what historical patterns suggest as we transition into September.
The Bigger Picture: A Half-Year Kenyan Investors Won’t Forget
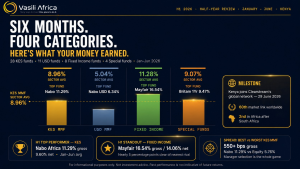
Kenyan investors are sitting roughly KSh 800 billion richer than they were at the start of the year, driven by a Nairobi Securities Exchange that has enjoyed one of its strongest runs in recent financial history. It is the type of market backdrop that makes every fund fact sheet considerably more compelling to read.

Figure 1: NSE all-share performance vs. the average managed equity unit trust fund, H1 2026.
- NSE growth: The Nairobi bourse delivered gains of roughly 26% in the first half of the year — a standout run by any regional measure.
- Equity funds trailed: Collective investment schemes, unit trusts, and equity funds posted a lower average return of 16.6% over the same period, serving as a clear reminder that active management does not always keep pace with a roaring index.
- Stockbroker revenues nearly tripled: Performance was heavily lifted by big-ticket transactions such as the Kenya Pipeline Company IPO alongside stronger fund management fee income.
- Corporate and insurer earnings impressed: Heavyweights including CIC Insurance and Equity Group posted high double-digit net profit growth, driven largely by robust investment income.
Kenya Shilling Money Market Funds
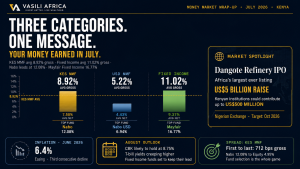
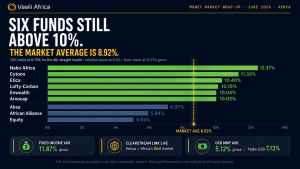
Across twenty-nine funds competing in a single currency, a spread of nearly four and a half percentage points separated the top performer from the rest of the field. Cytonn Money Market Fund maintained its lead this month with a net return of 8.95% after tax, narrowly edging out Nabo Africa (8.82%) and Faulu (8.77%). What stands out most is how tightly bunched the top fifteen funds remain—most are clustered within a single percentage point of one another. This highlights that the key differentiator across funds lies less in divergent strategies and more in rigorous cost discipline and portfolio quality.

Figure 2: KES money market fund net returns after tax, August 2026. Yellow marks the month’s top performer.
| Fund Manager | Fund Name | Average (%) | Net Return – Tax (%) |
|---|---|---|---|
| Cytonn Asset Managers Limited | Cytonn Money Market Fund | 10.53 | 8.95 |
| Nabo Capital Limited | Nabo Africa Money Market Fund | 10.38 | 8.82 |
| Faulu Microfinance Bank | Faulu Money Market Fund | 10.32 | 8.77 |
| Etica Capital Limited | Etica Money Market Fund | 10.31 | 8.76 |
| Enwealth Financial Services | Enwealth Money Market Fund | 10.14 | 8.62 |
| Lofty-Corban | Lofty-Corban Money Market Fund | 10.10 | 8.59 |
| Madison Investment Managers Limited | Madison Money Market Fund | 10.02 | 8.52 |
| Kuza Asset Management Limited | Kuza Money Market Fund (KES) | 9.98 | 8.48 |
| Globotec Asset Managers Limited | Globotec | 9.91 | 8.42 |
| Arvocap | Arvocap Money Market Fund | 9.90 | 8.41 |
| Old Mutual Investment Group | Old Mutual Money Market Fund | 9.86 | 8.38 |
| Capital A Investment Bank | Rejesha Money Market Fund | 9.85 | 8.37 |
| Jubilee Financial Services Limited | Jubilee Money Market Fund | 9.73 | 8.27 |
| Gulfcap | Gulfcap Money Market Fund | 9.67 | 8.22 |
| Britam Asset Managers (Kenya) Limited | Britam Money Market Fund | 9.64 | 8.20 |
| Orient Asset Managers | Orient Kasha Money Market Fund | 9.61 | 8.17 |
| GenAfrica Asset Managers Limited | GenAfrica Money Market Fund | 9.49 | 8.07 |
| Sanlam Investments East Africa Limited | Sanlam Money Market Fund | 9.24 | 7.85 |
| KCB Group | KCB Money Market Fund | 8.90 | 7.56 |
| Apollo Asset Management Company Limited | Apollo Money Market Fund | 8.89 | 7.56 |
| Dry Associates | Dry Associates Money Market Fund | 8.66 | 7.36 |
| CPF | CPF Money Market Fund | 8.58 | 7.29 |
| Genghis Capital | Genghis Money Market Fund | 8.15 | 6.92 |
| CIC Asset Managers Limited | CIC Money Market Fund | 8.06 | 6.85 |
| Mayfair Asset Managers | Mayfair Money Market Fund | 7.73 | 6.57 |
| ICEA Lion Asset Management Limited | ICEA Lion Money Market Fund | 7.66 | 6.51 |
| Co-op Trust Investment Services Limited | Co-op Money Market Fund | 7.66 | 6.51 |
| African Alliance | African Alliance Kenya Money Market Fund | 7.49 | 6.36 |
| ABSA Bank | Absa Shilling Fund MMF | 7.10 | 6.03 |
| Equity Bank | Equity Money Market Fund | 5.12 | 4.35 |
| Summary | Daily Cumulative Average | 9.09 | 7.73 |
US Dollar Money Market Funds
For investors holding US dollars, Nabo Africa’s USD fund continues to set the pace at a 5.58% net return, positioning itself comfortably ahead of Etica MMF USD (5.25%). The dollar fund universe is naturally smaller and, given the broader global interest rate environment, yields sit below shilling-denominated returns on average. The cumulative average for USD funds stands at 4.22%, well below its KES counterpart. Nevertheless, for investors managing foreign currency exposure or holding dollar-denominated obligations, these funds offer a highly productive alternative to letting cash remain idle.

Figure 3: USD money market fund net returns after tax, August 2026.
| Fund Manager | Fund Name | Average (%) | Net Return – Tax (%) |
|---|---|---|---|
| Nabo Capital Limited | Nabo Africa Money Market Fund USD | 6.57 | 5.58 |
| Etica MMF | Etica MMF USD | 6.18 | 5.25 |
| KCB Group | KCB Money Market Fund USD | 5.24 | 4.45 |
| Sanlam Investments East Africa Limited | Sanlam Money Market Fund USD | 5.03 | 4.28 |
| Kuza Asset Management Limited | Kuza Money Market Fund USD | 5.00 | 4.25 |
| Jubilee | Jubilee MMF USD | 4.94 | 4.20 |
| Dry Associates | Dry Associates Money Market Fund USD | 4.69 | 3.98 |
| Britam Asset Managers (Kenya) Limited | Britam Money Market Fund | 4.35 | 3.70 |
| Old Mutual Investment Group | Old Mutual Money Market Fund USD | 4.34 | 3.69 |
| ABSA Bank | Absa Dollar Fund MMF | 4.29 | 3.64 |
| CIC Asset Managers Limited | CIC Money Market Fund USD | 4.02 | 3.42 |
| Summary | Daily Cumulative Average | 4.97 | 4.22 |
Fixed Income Funds
This segment delivered the most striking movement in August. Mayfair Fixed Income Fund posted an impressive 14.29% net return—nearly four percentage points clear of the second-placed fund and well above the category’s cumulative average of 10.33%. Nabo Africa’s fixed income fund (11.56%) and Zimele (9.65%) rounded out a strong month for the category, which comfortably outperformed money market funds across the board. The main trade-off for these higher returns remains longer duration exposure and typically reduced liquidity.

Figure 4: Fixed income fund net returns after tax, August 2026.
| Fund Manager | Fund Name | Average (%) | Net Return – Tax (%) |
|---|---|---|---|
| Mayfair Asset Managers | Mayfair Fixed Income Fund | 16.81 | 14.29 |
| Nabo Asset Managers | Nabo Africa Fixed income Fund | 13.60 | 11.56 |
| Zimele Asset Management | Zimele Fixed Income Fund | 11.35 | 9.65 |
| Kuza Asset Management | Kuza Fixed Income Fund (KES) | 10.85 | 9.23 |
| Madison Asset Managers | Madison Fixed Income Fund | 10.60 | 9.01 |
| Gulfcap | Gulf cap fixed income fund | 9.71 | 8.25 |
| Summary | Daily Cumulative Average | 12.15 | 10.33 |
In Other News: Dangote’s Landmark IPO
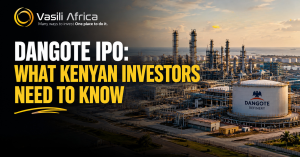
Beyond Kenya’s borders, markets across Africa are closely watching what could become the continent’s largest public share sale to date. Dangote Petroleum Refinery and Petrochemicals officially signed the necessary documentation for its initial public offering in Lagos this week, marking a major milestone toward listing.
- The company will offer 4.1 billion shares at ₦525 per share (approximately US$0.4) from 14 September to 13 October, targeting roughly ₦2.15 trillion (US$1.63 billion) if fully subscribed.
- Dangote plans to invest US$14.3 billion to double the refinery’s processing capacity to 1.4 million barrels per day by 2029.
“We are opening ownership of this strategic asset to a broader community of investors and creating an opportunity for Nigerians to participate directly in its future growth and value creation,” said Dangote regarding the landmark offering.
What to Watch: A Look Ahead to September 2026
SPECULATIVE — VIEWS BELOW ARE DIRECTIONAL, NOT GUARANTEED
Three key drivers are likely to shape market conditions in September:
- 1. Yield Momentum: Money market yields have trended downward slightly throughout 2026 as the Central Bank retains scope for further monetary easing. Investors should expect the cumulative average for KES funds to drift toward the high-7% range rather than rebounding above 8%.
- 2. Stock Market Consolidation: The NSE’s remarkable 26% gain in the first half raises questions about sustainability, as rallies of this magnitude rarely move in a straight line. A temporary pause or mild retracement in September would align with historical market behavior following strong initial halves in Kenyan equities.
- 3. Fixed Income Opportunities: Fixed income funds—particularly those with longer durations like Mayfair’s—are positioned to continue outperforming money market funds as long as yields on government securities remain attractive. This category warrants careful consideration for investors with longer investment horizons.
Regionally, the opening of the Dangote IPO subscription window in mid-September will be an important benchmark for Kenyan investors. It serves as a key gauge of regional capital market depth and highlights the substantial value awaiting execution through public listings across Africa.
Our House View: Maintain diversification across currencies and asset durations, keep a close watch on fund-level fee structures which exert a larger cumulative impact than commonly assumed and treat any single month’s rankings as a single data point rather than a definitive conclusion.
This report is produced by Vasili Africa for informational purposes only and does not constitute investment advice. Past performance is not indicative of future results. Figures are net of tax and sourced from fund manager disclosures for August 2026.