1. MONEY MARKET FUNDS
Money Market fund rates declined slightly in September, with the average daily effective rate falling to 14.48% compared to August’s return of 14.60% p.a. The decline can be attributed to a corresponding drop in the returns on Treasury Bills (T-bills).
T-bills are a primary asset class in which money market funds invest due to their low risk and short-term nature. When T-bill rates fall, the returns for MMFs typically follow suit because the income generated from these government securities is a significant component of the MMF’s overall yield.
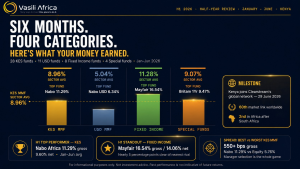
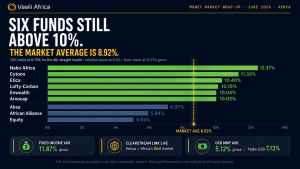
In terms of performance, The Lofty Corban Money Market Fund maintained its leading position for another month, posting an average daily return of 16.80% per annum, translating to a net return of 14.32% per annum after tax.
Cytonn, Etica, Arvocap, and Kuza Money Market Funds followed closely, with daily average effective rates of 16.72%, 16.21%, 16.04%, and 15.73% per annum, respectively.
A Money Market Fund is useful if:
- You are just starting your investment journey: it’s a good way to start accumulating your savings and investment goals to diversify to other asset classes.
- You are looking to pack some money away for a later date project.
- You are building up your emergency fund.
- You are saving for a sinking fund like school fees, insurance payments, or asset purchases.
- You are in a chama/investment group: a few fund managers have a chama manager that can help you track the chama contributions and transactions.
Daily Average Yields for MMFs in September
| NO. | FUND MANAGER | FUND NAME | DAILY AVERAGE RETURN(% p.a.) | NET RETURN(% p.a.) |
| 1 | Lofty-Corban | Lofty-Corban Money Market Fund | 16.80 | 14.28 |
| 2 | Cytonn Asset Managers Limited | Cytonn Money Market Fund | 16.72 | 14.21 |
| 3 | Etica Capital Limited | Etica Money Market Fund | 16.21 | 13.78 |
| 4 | Arvocap | Arvocap Money Market Fund | 16.04 | 13.63 |
| 5 | Kuza Asset Management Limited | Kuza Money Market Fund (KES) | 15.73 | 13.37 |
| 6 | GenAfrica Asset Managers Limited | GenAfrica Money Market Fund | 15.36 | 13.05 |
| 7 | Apollo Asset Management Company Limited | Apollo Money Market Fund | 15.11 | 12.84 |
| 8 | Jubilee Financial Services Limited | Jubilee Money Market Fund | 14.98 | 12.73 |
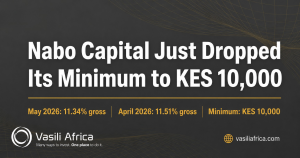
| 9 | Nabo Capital Limited | Nabo Africa Money Market Fund | 14.86 | 12.63 |
| 10 | ABSA Bank | Absa Shilling Fund MMF | 14.84 | 12.62 |
| 11 | KCB Group | KCB Money Market Fund | 14.56 | 12.38 |
| 12 | Madison Investment Managers Limited | Madison Money Market Fund | 14.50 | 12.33 |
| 13 | Co-op Trust Investment Services Limited | Co-op Money Market Fund | 14.41 | 12.25 |
| 14 | Genghis Capital | Genghis Money Market Fund | 14.37 | 12.22 |
| 15 | Sanlam Investments East Africa Limited | Sanlam Money Market Fund | 14.20 | 12.07 |
| 16 | Mayfair Asset managers | Mayfair Money Market Fund | 14.00 | 11.90 |
| 17 | Orient Asset Managers | Orient Kasha Money Market Fund | 13.98 | 11.88 |
| 18 | African Alliance | African Alliance Kenya Money Market Fund | 13.90 | 11.81 |
| 19 | Dry Associates | Dry Associates Money Market Fund | 13.28 | 11.28 |
| 20 | Old Mutual Investment Group | Old Mutual Money Market Fund | 13.20 | 11.22 |
| 21 | ICEA Asset Lion Asset Management Limited | ICEA Lion Money Market Fund | 13.00 | 11.05 |
| 22 | CIC Asset Managers Limited | CIC Money Market Fund | 12.91 | 10.97 |
| 23 | Britam Asset Managers (Kenya) Limited | Britam Money Market Fund | 12.44 | 10.57 |
| 24 | Equity Bank | Equity Money Market Fund | 12.02 | 10.21 |
| CUMULATIVE DAILY AVERAGE (%) | 14.48 | 12.30 | ||
Dollar Money Market Fund Returns
For the Dollar Money Market Funds, Kuza MMF USD fund secured the top position with an average return of 6.86%, followed by Etica, Lofty Corban, Jubilee and Dry Associates which posted daily average returns of 6.76%, 6.32%, 6.30%, and 6.28% per annum, respectively.
| NO. | FUND MANAGER | FUND NAME | AVERAGE DAILY RETURN (% p.a.) |
| 1 | Kuza Asset Management Limited | Kuza Money Market Fund USD | 6.86 |
| 2 | Etica MMF | Etica MMF USD | 6.76 |
| 3 | Lofty-Corban | Lofty-Corban Money Market Fund USD | 6.32 |
| 4 | Jubilee | Jubilee MMF USD | 6.30 |
| 5 | Dry Associates | Dry Associates Money Market Fund USD | 6.28 |
| 6 | Sanlam Investments East Africa Limited | Sanlam Money Market Fund USD | 5.58 |
| 7 | ABSA Bank | Absa Dollar Fund MMF | 5.38 |
| 8 | CIC Asset Managers Limited | CIC Money Market Fund USD | 5.13 |
| 9 | Old Mutual Investment Group | Old Mutual Money Market Fund USD | 5.09 |
| 10 | KCB Group | KCB Money Market Fund USD | 4.93 |
| 11 | Nabo Capital Limited | Nabo Africa Money Market Fund USD | 4.90 |
| CUMULATIVE DAILY AVERAGE (%) | 5.78 | ||
Fixed Income Funds
The Kuza Fixed Income Fund delivered an impressive return of 15.09% per annum, followed by Madison, Etica, Nabo, and Zimele Fixed Income Funds, which recorded average daily effective returns of 14.80%, 14.66%, 14.08%, and 13.43% per annum, respectively.
| NO. | FUND MANAGER | FUND NAME | AVERAGE DAILY RETURN(% p.a.) |
| 1 | Kuza Asset Management | Kuza Fixed Income Fund (KES) | 15.09 |
| 2 | Madison Asset Managers | Madison Fixed Income Fund | 14.80 |
| 3 | Etica | Etica Fixed Income Fund | 14.66 |
| 4 | Nabo Asset Nanagers | Nabo Africa Fixed income Fund | 14.08 |
| 5 | Zimele Asset Management | Zimele Fixed Income Market Fund | 13.43 |
| 6 | Britam Asset Managers (Kenya) Limited | British Bond Plus Fund | 13.11 |
| 7 | Mayfair Asset Managers | Mayfair Fixed Income Fund | 11.81 |
| 8 | NCBA | NCBA Fixed Income Fund | 11.48 |
| 9 | Sanlam Investments East Africa Limited | Sanlam Fixed Income Fund | 6.71 |
Special Funds
In the Special Funds category, the Lofty Corban Special MMF led the rankings with a return of 16.50% p.a.
| NO. | FUND MANAGER | FUND NAME | AVERAGE DAILY RETURN(% p.a.) |
| 1 | Lofty Corban Asset Management | Lofty-Corban Special Money Market Fund | 16.50 |
| 2 | Britam Asset Managers (Kenya) Limited | Britam Special Fixed Income Fund 1 year | 12.68 |
| 3 | Britam Asset Managers (Kenya) Limited | Britam Special Fixed Income Fund 6 Months | 12.51 |
| 4 | Britam Asset Managers (Kenya) Limited | Britam Special Fixed Income Fund 3 months | 12.49 |
| 5 | CIC Asset Managers Limited | CIC Wealth Fund | 11.00 |
2. GOVERNMENT BONDS
According to data from the Central Bank of Kenya, the interest rates on the 91-day, 182-day, and 364-day Treasury bills have fallen steadily since the beginning of August 2024 which consequentially led to the general decline in interest rates over the various asset classes above.
Analysts at AIB-XYS attribute the decline to the CBK’s resolve to nudge interest rates lower amid an easing risk landscape. The decline can also be a result of increased liquidity. As liquidity increases, driven by factors like higher foreign remittances, improved government spending, and reduced private-sector borrowing, banks have more funds to lend, leading to increased competition and lower loan rates.
Additionally, inflation in Kenya fell to 3.6% in September from 4.4% in August 2024, preserving the real purchasing power of money. This reduction in inflation allows the Central Bank of Kenya (CBK) to lower interest rates without causing inflationary pressures, making borrowing cheaper and encouraging investment and consumption, which supports economic growth.
In September, the Central Bank of Kenya (CBK) accepted bids worth KES 32B over and above the advertised amount of KES 15B for the tap sale of IFB1/2023/17. Additionally, the Government re-opened two Fixed coupon bonds (FXD), FXD1/2024/010 (remaining 9.5 years) and FXD1/2016/020 (remaining 12 years) aiming to raise KES 30 billion. The re-opened bonds have fixed coupon rates of 16.00% and 14.00%, respectively, and accepted bids totalling KES 19.27 billion, resulting in an undersubscription.
Particulars of the Bonds
| Name | Duration (years) | Coupon Rate | Coupon Months | Maturity |
| FXD1/2024/010 | 9.5 | 16 | March & September | March 2034 |
| FXD1/20216/020 | 12 | 14 | March & September | September 2036 |
3. EQUITIES
In September, the Kenyan stock market experienced an upward trend, with the NSE 20 gaining 5.8%, NSE 25 rising by 3.5%, NASI increasing by 3.6%, and NSE 10 advancing by 3.9%. This positive performance was primarily driven by gains in large-cap companies such as KCB, Equity, and Safaricom, which saw increases of 11%, 8%, and 3%, respectively.
As at the end of September, foreign investors exhibited a bearish sentiment towards select blue-chip stocks, leading to a net outflow of USD 0.11 million for the month.
4. GLOBAL MARKETS
a) United States:
- Equities: Entered September on a high note after recovering from an 8.5% pullback in the S&P 500, with the index closing just 0.13% shy of its all-time high.
- Economic Data: U.S. growth concerns emerged, driven by the unwinding of the yen carry trade. Despite these factors, the S&P 500 ended the month up 21% year-to-date, and the Nasdaq gained 22.7%.
- Sectors: Tech stocks led the recovery, while financials and consumer staples remained under pressure.
b) Eurozone:
- Equities: The Stoxx Europe 600 hit a record high, posting a year-to-date return of 10.36%.
- Economic Data: Eurozone inflation slowed to a three-year low of 2.2% in August. Concerns rose around the German and Italian economies, with industrial output declining.
- Sectors: Energy and real estate sectors saw gains, but manufacturing struggled, particularly in Germany and Italy.
c) UK:
- Equities: Market fell, partly buoyed by the pound’s strength following the Bank of England’s decision to hold off on a second rate cut.
- Economic Data: Headline CPI held steady at 2.2%, while core inflation rose to 3.6%. Service inflation increased, with wage growth also showing an uptick.
- Sectors: Consumer discretionary and real estate underperformed.
d) Japan:
- Equities: The Nikkei 225 gained nearly 3% in September.
- Economic Data: Consumer prices rose 3% year-on-year, marking the highest level since October 2023. The yen strengthened, narrowing the interest rate gap after the BOJ raised rates to 0.25%.
- Sectors: Domestically focused stocks performed well, while growth stocks faced more pressure.
e) Asia (ex-Japan):
Equities: Declines across major markets.
- China: CSI 300 and Hang Seng posted strong gains of 15.7% and 13%, respectively, following stimulus announcements.
- Other Regions: South Korea, Taiwan, and Hong Kong experienced sharp declines amid weak manufacturing and property sector issues.