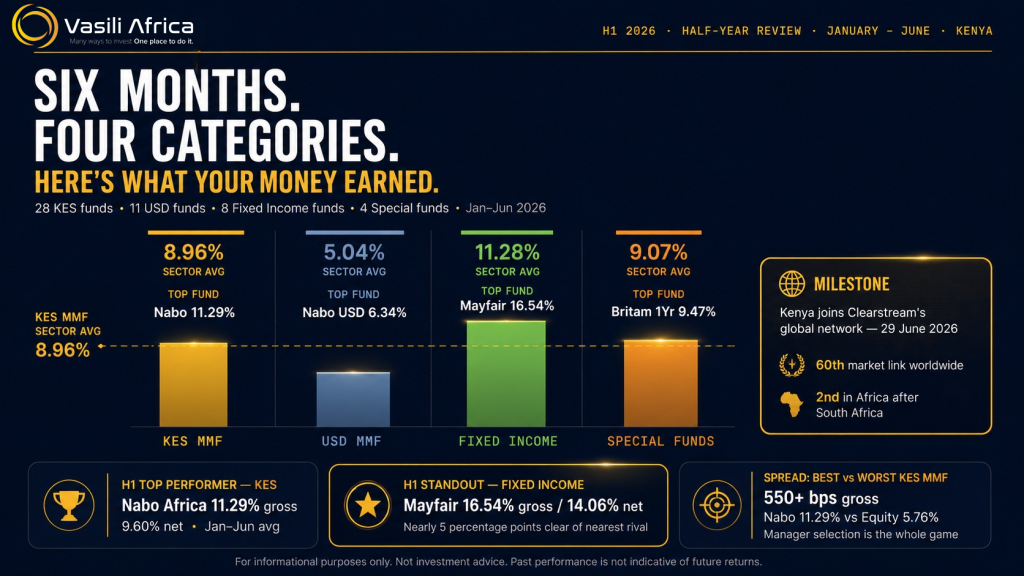
How Kenya’s money market funds performed from January to June, and what it means for the second half of the year.
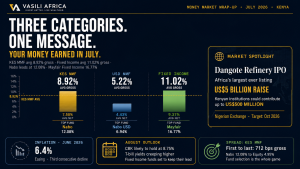
Six months ago, Kenya’s money market funds were still riding the tail end of a high-rate era, with some funds throwing off returns north of 11% and savers feeling, for once, like the smart money and the safe money were the same thing. Halfway through 2026, the picture has shifted not dramatically, but unmistakably. The Central Bank of Kenya trimmed its policy rate from 9.0% in January to 8.75% in February and has held steady there ever since, a signal that the inflation fight, while not over, is no longer the five-alarm fire it once was. Inflation itself told a similarly uneven story: 4.4% in January, easing to 4.3% in February, ticking back up to 4.4% in March, then climbing to 5.6% in April and 6.7% in May, before cooling to 6.4% in June a reminder that fuel, transport and food prices, not runaway demand, have been doing most of the driving.
For money market funds, lower and steadier rates mean one thing above all: the easy double-digit returns of the past are giving way to a more modest, more selective market. But ‘modest’ is relative as this half-year review shows, the gap between the best-run funds and the rest of the pack has, if anything, widened. Where you park your money in H2 will matter more than it has in a while.
And then, right at the tail end of the half, came a genuine milestone: on June 29, 2026, the Central Bank of Kenya and Clearstream, the Deutsche Börse Group’s post-trade giant, switched on a new market link connecting Clearstream’s global network directly to DhowCSD, Kenya’s central securities depository. In plain terms, it is now dramatically easier for large international investors to buy, hold and settle Kenyan government securities without opening a local account. Standard Chartered Kenya steps in as the cash correspondent and local custodian. Kenya becomes Clearstream’s 60th market link worldwide and only the second in Africa, after South Africa, a small institutional detail with potentially large consequences for how much foreign money finds its way into Kenyan government paper in the months ahead.
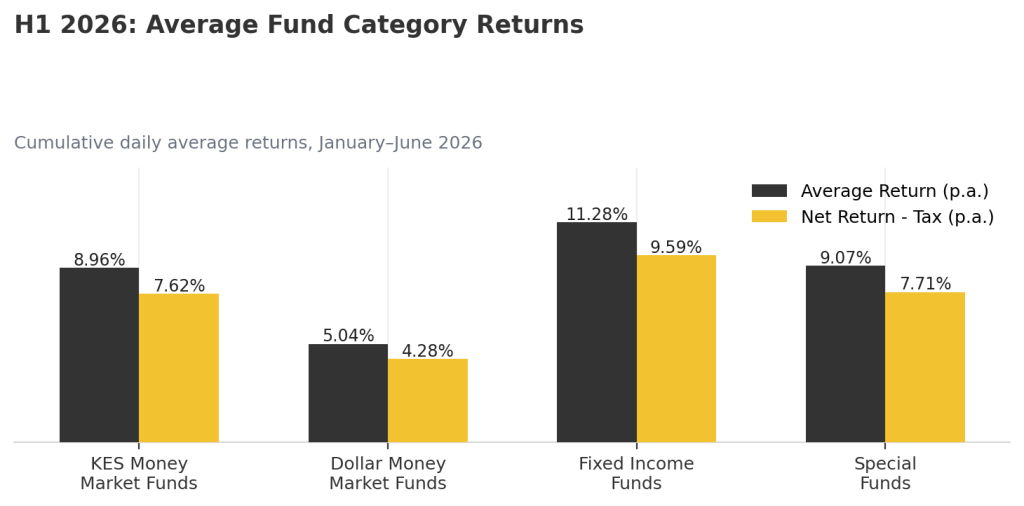
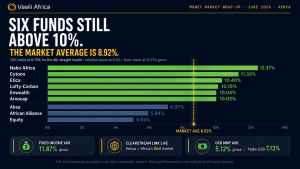
Figure 1: Average H1 2026 returns by fund category — Fixed Income funds led, Dollar funds lagged, as expected in a still-elevated but easing rate environment.
KES Money Market Funds: The Home Turf Battle
In the shilling-denominated money market fund space, still the default home for the bulk of Kenyan savers’ short-term cash, Nabo Africa Money Market Fund took the H1 crown, delivering an average daily return of 11.29% p.a. (9.60% net of tax). Cytonn Money Market Fund was close behind at 11.06% p.a. (9.40% net), with Lofty-Corban (10.24% p.a., 8.71% net) and Etica (10.12% p.a., 8.60% net) rounding out a tight top four. Jubilee Money Market Fund closed out the top five at 9.82% p.a. (8.35% net).
The overall pack averaged 8.96% p.a. (7.62% net) across the half, a useful benchmark, but one that hides real dispersion. At the other end of the table, African Alliance Kenya Money Market Fund (5.77% p.a.) and Equity Money Market Fund (5.76% p.a.) trailed the field by more than five percentage points, a gap wide enough to matter on any meaningful balance.
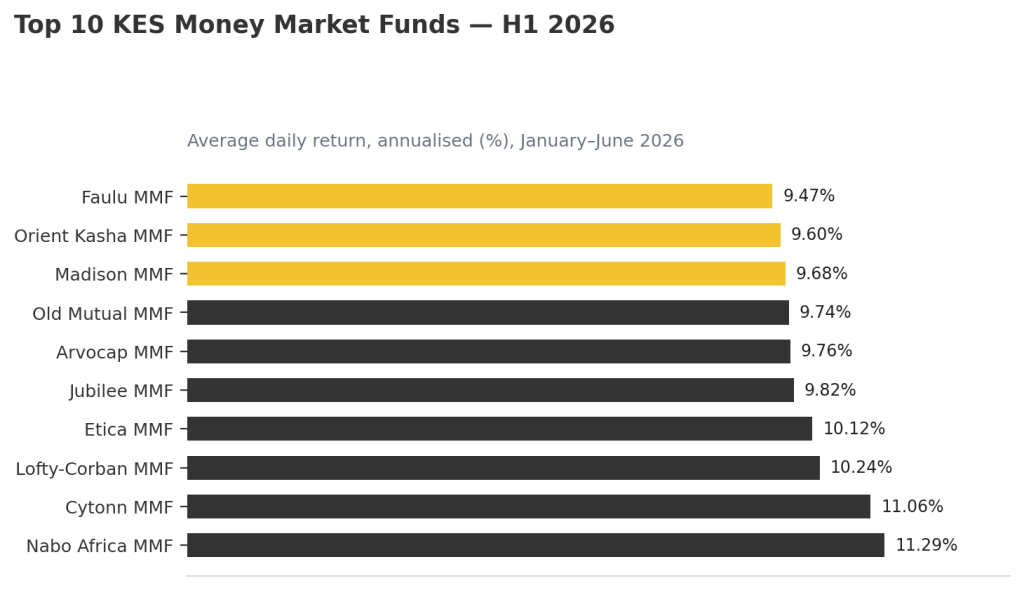
Figure 2: The ten best-performing KES money market funds in H1 2026.
| Manager | Name of Fund | Average | Net Return -tax |
|---|---|---|---|
| Nabo Capital Limited | Nabo Africa Money Market Fund | 11.29 | 9.60 |
| Cytonn Asset Managers Limited | Cytonn Money Market Fund | 11.06 | 9.40 |
| Lofty-Corban | Lofty-Corban Money Market Fund | 10.24 | 8.71 |
| Etica Capital Limited | Etica Money Market Fund | 10.12 | 8.60 |
| Jubilee Financial Services Limited | Jubilee Money Market Fund | 9.82 | 8.35 |
| Arvocap | Arvocap Money Market Fund | 9.76 | 8.30 |
| Old Mutual Investment Group | Old Mutual Money Market Fund | 9.74 | 8.28 |
| Madison Investment Managers Limited | Madison Money Market Fund | 9.68 | 8.23 |
| Orient Asset Managers | Orient Kasha Money Market Fund | 9.60 | 8.16 |
| Faulu Microfinance Bank | Faulu Money Market Fund | 9.47 | 8.05 |
| Gulfcap | Gulfcap Money Market Fund | 9.38 | 7.97 |
| Britam Asset Managers (Kenya) Limited | Britam Money Market Fund | 9.30 | 7.90 |
| Enwealth Financial Services | Enwealth Money Market Fund | 9.29 | 7.90 |
| GenAfrica Asset Managers Limited | GenAfrica Money Market Fund | 9.15 | 7.78 |
| Dry Associates | Dry Associates Money Market Fund | 9.03 | 7.68 |
| CPF | CPF Money Market Fund | 8.89 | 7.55 |
| Sanlam Investments East Africa Limited | Sanlam Money Market Fund | 8.88 | 7.55 |
| CIC Asset Managers Limited | CIC Money Market Fund | 8.80 | 7.48 |
| KCB Group | KCB Money Market Fund | 8.78 | 7.46 |
| Apollo Asset Management Company Limited | Apollo Money Market Fund | 8.63 | 7.34 |
| Genghis Capital | Genghis Money Market Fund | 8.48 | 7.21 |
| Kuza Asset Management Limited | Kuza Money Market Fund (KES) | 8.17 | 6.94 |
| ABSA Bank | Absa Shilling Fund MMF | 8.07 | 6.86 |
| Mayfair Asset Managers | Mayfair Money Market Fund | 8.04 | 6.84 |
| Co-op Trust Investment Services Limited | Co-op Money Market Fund | 7.90 | 6.72 |
| ICEA Asset Lion Asset Management Limited | ICEA Lion Money Market Fund | 7.80 | 6.63 |
| African Alliance | African Alliance Kenya Money Market Fund | 5.77 | 4.91 |
| Equity Bank | Equity Money Market Fund | 5.76 | 4.90 |
| Daily Cumulative Average | 8.96 | 7.62 |
Note: Past performance should not be used as a guide to future investment performance.
Money Market Funds remain a compelling choice for investors who prioritize:
- Liquidity: Easy access to funds for unforeseen needs.
- Stability: Limited exposure to market volatility compared to equity-focused funds.
The recalibration of expectations, though, is no longer optional, it’s the whole story. With average returns trending gradually lower and the spread between top and bottom performers widening, picking a fund manager well is doing more of the work than it used to. Investors leaning on money market funds purely for yield may want to pair them with fixed income or special fund allocations discussed later in this review.
Dollar Money Market Funds: Playing Defense in Hard Currency
For investors hedging shilling risk or simply banking dollar income, Nabo Africa Money Market Fund USD kept its lead through H1, returning 6.34% p.a. (5.39% net) comfortably ahead of Etica MMF USD (5.63% p.a., 4.79% net) and Dry Associates Money Market Fund USD (5.46% p.a., 4.64% net). The category average settled at 5.04% p.a. (4.28% net), a level that continues to track global dollar interest rates more closely than anything happening at the CBK’s rate-setting table.
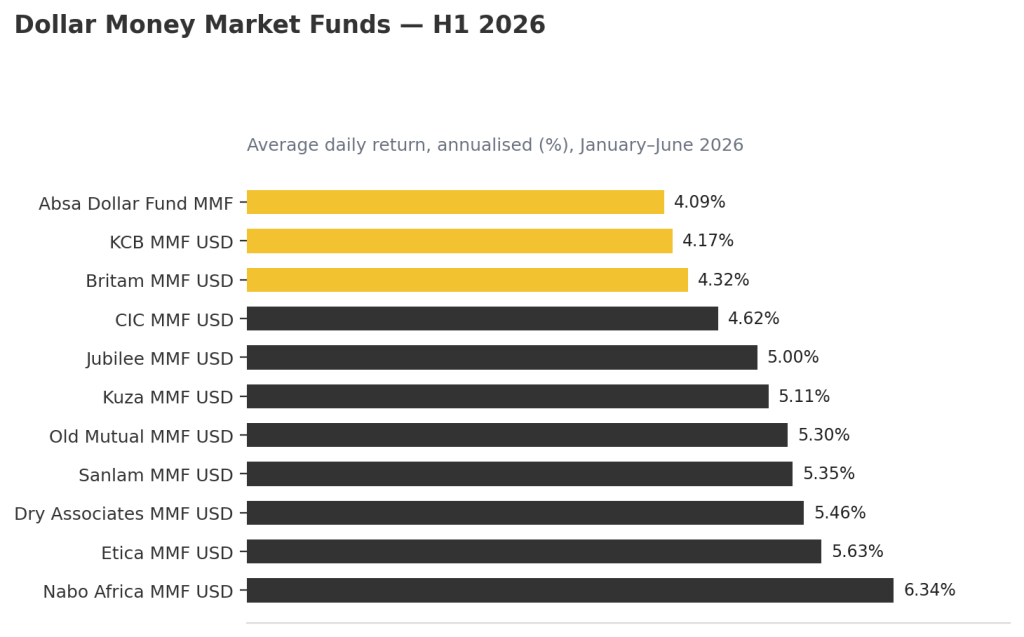
Figure 3: All eleven Dollar Money Market Funds ranked by H1 2026 average return.
| Manager | Name of Fund | Average | Net Return -tax |
|---|---|---|---|
| Nabo Capital Limited | Nabo Africa Money Market Fund USD | 6.34 | 5.39 |
| Etica MMF | Etica MMF USD | 5.63 | 4.79 |
| Dry Associates | Dry Associates Money Market Fund USD | 5.46 | 4.64 |
| Sanlam Investments East Africa Limited | Sanlam Money Market Fund USD | 5.35 | 4.55 |
| Old Mutual Investment Group | Old Mutual Money Market Fund USD | 5.30 | 4.50 |
| Kuza Asset Management Limited | Kuza Money Market Fund USD | 5.11 | 4.34 |
| Jubilee | Jubilee MMF USD | 5.00 | 4.25 |
| CIC Asset Managers Limited | CIC Money Market Fund USD | 4.62 | 3.92 |
| Britam Asset Managers (Kenya) Limited | Britam Money Market Fund USD | 4.32 | 3.67 |
| KCB Group | KCB Money Market Fund USD | 4.17 | 3.55 |
| ABSA Bank | Absa Dollar Fund MMF | 4.09 | 3.48 |
| Daily Cumulative Average | 5.04 | 4.28 |
Note: Past performance should not be used as a guide to future investment performance.
Fixed Income Funds: Where the Real Yield Still Hides
If H1 2026 had a standout category, this was it. The Mayfair Fixed Income Fund posted a commanding 16.54% p.a. (14.06% net) nearly five percentage points clear of its nearest rival, Nabo Africa Fixed Income Fund, at 11.88% p.a. (10.10% net). Zimele Fixed Income Fund followed at 11.51% p.a. (9.79% net). The category average of 11.28% p.a. (9.59% net) makes fixed income funds the highest-yielding mainstream option covered in this review, rewarding investors willing to accept slightly less liquidity than a money market fund in exchange for materially better returns.
Worth flagging: NCBA Fixed Income Fund appears in our data for the first time this half, entering at the bottom of the table with 8.21% p.a. (6.98% net) a reminder that new entrants often need a few reporting cycles to find their footing.
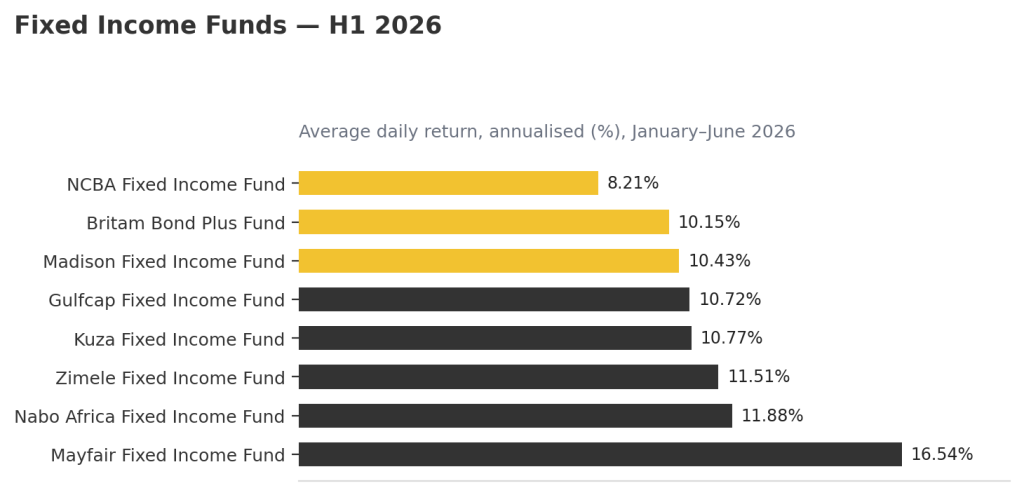
Figure 4: Fixed Income Fund performance, H1 2026 — Mayfair’s lead is the story of the half.
| Manager | Name of Fund | Average | Net Return -tax |
|---|---|---|---|
| Mayfair Asset Managers | Mayfair Fixed Income Fund | 16.54 | 14.06 |
| Nabo Asset Managers | Nabo Africa Fixed Income Fund | 11.88 | 10.10 |
| Zimele Asset Management | Zimele Fixed Income Fund | 11.51 | 9.79 |
| Kuza Asset Management | Kuza Fixed Income Fund (KES) | 10.77 | 9.16 |
| Gulfcap | Gulf Cap Fixed Income Fund | 10.72 | 9.12 |
| Madison Asset Managers | Madison Fixed Income Fund | 10.43 | 8.87 |
| Britam Asset Managers (Kenya) Limited | Britam Bond Plus Fund | 10.15 | 8.63 |
| NCBA | NCBA Fixed Income Fund | 8.21 | 6.98 |
| Daily Cumulative Average | 11.28 | 9.59 |
Note: Past performance should not be used as a guide to future investment performance.
Special Funds: The New Kids on the Block
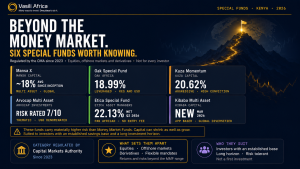
A newer, smaller category worth watching: special and tenor-based funds, which let investors lock in a return for a defined period rather than staying fully liquid. Britam’s suite of Special Fixed Income Funds led this space, with the 1-Year option returning 9.47% p.a. (8.05% net), the 3-Month option at 9.28% p.a. (7.88% net), and the 6-Month option at 9.21% p.a. (7.83% net) a tight cluster suggesting Britam is pricing its tenors consistently across the curve. CIC Wealth Fund rounded out the category at 8.31% p.a. (7.06% net). The category average came in at 9.07% p.a. (7.71% net), comfortably ahead of the broader money market fund average the reward, in effect, for giving up a little flexibility.
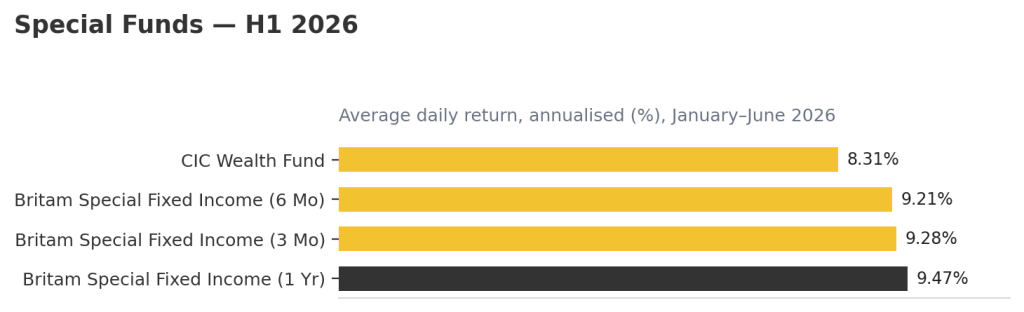
Figure 5: Special Funds — tenor-based products, H1 2026.
| Manager | Name of Fund | Average | Net Return -tax |
|---|---|---|---|
| Britam Asset Managers (Kenya) Limited | Britam Special Fixed Income Fund – 1 Year | 9.47 | 8.05 |
| Britam Asset Managers (Kenya) Limited | Britam Special Fixed Income Fund – 3 Months | 9.28 | 7.88 |
| Britam Asset Managers (Kenya) Limited | Britam Special Fixed Income Fund – 6 Months | 9.21 | 7.83 |
| CIC Asset Managers Limited | CIC Wealth Fund | 8.31 | 7.06 |
| Daily Cumulative Average | 9.07 | 7.71 |
Note: Past performance should not be used as a guide to future investment performance.
What to Expect in H2 2026
None of this is a forecast carved in stone, markets have a way of humbling anyone who gets too confident, but the trends of H1 do point somewhere. Here is a grounded, fact-led read on the second half of the year:
- Interest rates: The CBR has sat at 8.75% since February, and the MPC has been consistent in framing recent inflation upticks as import-driven , oil, transport, fertiliser :rather than a demand problem. Expect the Central Bank to hold rates through most of H2 unless a fresh external shock forces its hand, with a modest cut becoming plausible only if inflation settles convincingly nearer the 5.0% midpoint.
- Government securities and yields: The Clearstream–Kenya Link, live since June 29, is the biggest wildcard of the half. If foreign institutional money starts flowing into Kenyan T-bills and bonds through the new DhowCSD connection as intended, expect gentle downward pressure on yields as demand for government paper firms up good news for bond prices, a little less good for anyone hunting fresh double-digit T-bill returns.
- Money market fund returns: The gradual grind lower in KES MMF averages from double digits toward high single digits is likely to continue into H2, simply because maturing high-yield paper keeps rolling into lower-yielding replacements. Expect the gap between top-quartile and bottom-quartile funds to stay wide, making manager selection more important than it has been in years.
- Fixed income and special funds: With the category still averaging well above money market funds, expect continued investor migration toward fixed income and tenor-based special funds for anyone comfortable trading a little liquidity for yield particularly if further rate cuts start to look likely toward year-end.
- Dollar funds: Expect USD MMF returns to keep tracking global dollar rates rather than local policy, holding roughly in the current 4–6% band absent a major shift from the US Federal Reserve.
- The wildcard to watch: how quickly foreign investors actually use the new Clearstream link. A strong, early uptake could tighten Kenyan yields faster than the above suggests; a slow start would leave the current gentle-decline trend largely intact.
As ever, these are informed expectations built on the trends already in the data, not guarantees. Investors should treat them as a starting point for their own thinking, not a substitute for it.
Our data tracks performance on daily average returns as reported in the dailies. While past returns are not indicative of future outcomes, this information can help inform your investment decisions.
Ready to take the next step? Contact us today to learn more about how these investment products could fit into your portfolio.